K6 壓力測試結果圖表自動化工具
| | | 2 | |
先前示範了用 K6 對網站逐步加壓到噴出 503,當時我寫了一小段 C# 解析串流 JSON 檔轉成 CSV 並用 Excel 繪製圖表:
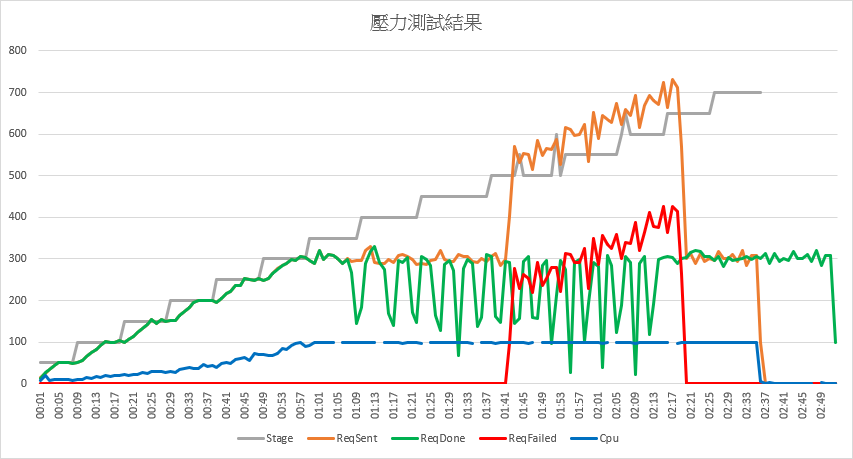
效果還不錯,但每次測試完得跑 C# 程式、複製 CSV 數字、貼到 Excel 範本,做完一串手工藝才能拿到圖表。我心中的壓力測試程序會是:先測一次當基準,升級硬體測一次,調個程式再測一次,有可能一小時要測個十來次。每次測完都要做一堆手工超出我的耐心極限,我開始動腦筋優化流程。
前幾天試了在 K6 測試腳本新增 Scenario 同時由 WebAPI 取回 CPU 使用率,CPU 數據同步存入結果 JSON,省下手工從伺服器取回效能計數器資料檔的麻煩,離「跑 K6 壓測存 JSON 檔,解析 JSON 檔繪成圖表」的理想又更近了。
經過評估,我決定將 C# 解析程式改寫成 Node.js 版,圖表部分則擺脫笨重的 Excel,改用 JavaScript 圖表程式庫繪製。這回需要的圖表算單純,用我熟悉的 Highcharts 有點殺雞用牛刀,另一方面免費版限非商業使用可能造成困擾,我挑了頗受歡迎 (Github 6 萬顆星) 的開源程式庫 - Chart.js 作為本次圖表擔當。
如此,整條生產線從 K6 壓測、資料解析到圖表繪製全部都用 JavaScript,開發者只需會一種語言就能搞定,豈不美哉?而我自己則藉此機會體驗 Node.js 程式開發並多學一套圖表程式庫,讓技能樹多冒兩根嫩芽,滿足自己的需求又學到新東西,這才符合 Side-Project 精神。
壓測程式部分我修改了前篇文章版本,將測試主機 IP/Port、測試 WebApi URL、最高目標流量(每秒發動多少次請求)、效能監視 API... 等當成參數,如此透過調參數就能測試不同 WebAPI (例如:SQLite vs SQLServer)、流量(例如:Target 500 vs 1000),至少切換測試對象及壓力數值時不用改程式。
stress.js 程式範例如下,但 default function() 部分需配合測試對象修改就是了。
import http from 'k6/http';
import { sleep, check } from 'k6';
import { getCurrentStageIndex } from 'https://jslib.k6.io/k6-utils/1.3.0/index.js';
import exec from 'k6/execution';

const baseUrl = __ENV.BASEURL || 'http://10.8.0.6';
const loadTarget = __ENV.TARGET || 700;
const apiPath = __ENV.APIPATH || 'Registration/TestJson';
const perfApiUrl = __ENV.PERFAPIURL || `${baseUrl}:5000`

const stages = [];
for (let t = 50; t <= loadTarget; t += 50) {
  stages.push({ duration: '5s', target: t }, { duration: '5s', target: t });
}
export const options = {
    systemTags: ['status','error'],
    scenarios: {
      stress: {
        executor: 'ramping-arrival-rate',
        preAllocatedVUs: 10000,
        timeUnit: "1s",
        stages: stages
      },
      monitor: {
        executor: 'constant-arrival-rate',
        preAllocatedVUs: 1,
        rate: 1,
        duration: 20 + stages.length * 5 + 's',
        timeUnit: "1s",
        exec: 'monitor'
      }
    }
};

const jsonPayload = `{
"LotteryUid":"b1a2bef2-0951-48c1-b97b-4a8988447c15",
"SoldTime":"2023-04-04T23:58:44.287528+08:00",
"RetailerId":"0000",
"Numbers":"AQgCAwUN",
"MegaNumber":7,
"ReqSign":"jcGK37pXuW9bGTKJ7/bmDSTuROx3TY/H31USgGtRfkc7pYFkFDoNg9XwJc7g9dUSBSEOWK7WCDJMDL8VlEn8OBttFTVgDc9nTPZpASdUawFJXhmLRgb7AVG5iWNsbxAAaDLW5yDEOEjzWsMpA5dukMJN6RHUUHfuVkux60nE240="
}`;

export default function() {
  let res = http.post(`${baseUrl}/${apiPath}`, jsonPayload, {
    tags: {
      sentTime: new Date().toISOString(),
      target: stages[getCurrentStageIndex()].target
    },
    headers: { 'Content-Type': 'application/json' }
  });
  check(res, {
    'status is 200': (r) => r.status === 200
  });
}

export function monitor() {
    let res = http.get(perfApiUrl);
    check(res, {
        'status is 200': (r) => r.status === 200
    }, { cpu: res.body.split(',')[1], time: res.body.split(',')[0] });
}
解析我寫了一支 k6-stress-test-chart.js,打算用 Node.js 執行,這是我第一次寫 Node.js 程式,如同一場探險之旅,靠 ChatGPT 幫忙,許多蠢問題瞬間得到答案,還不會被罵。XD 不過有些問題 Google 比較快,不必糾結非要 ChatGPT 回答。我自己拿捏的尺度是 Prompt 改兩次還沒有結果就改 Google,把反覆調整嘗試 Prompt 的時間拿來爬文更快得到答案。
筆記本次學到的 Node.js 技巧:
- 彈性命令列參數
使用 minimist 套件,var argv = require('minimist')(process.argv.slice(2));,可以從node example/parse.js -a beep -b boo test解析出{ _: ['test'], a: 'beep', b: 'boop' },方便彈性輸入命令列參數。 - 4 ways to read file line by line in Node.js
K6 輸出的 JSON 行數高達數十萬行,fs.readFile() 一次讀入會遇到cannot create a string longer than 0x1fffffe8 characters錯誤,我用 fs.createReadStream() 逐行讀取克服。 - Build a Command-Line Progress Bar in Node.JS
解析數十萬行的 JSON 要花上一兩分鐘,為避免等待焦慮,我學會用 readline.cursorTo(process.stdout, 0) 控制座標顯示進度數字,以及用 process.stdout.write("\x1B[?25l") 隱藏游標的技巧 - 預先做好 chart.html 圖表網頁範本,程式讀取範本 HTML 插入數據資料並另存新檔案,用瀏覽器開啟時呈現結果圖表
- How to use nodejs to open default browser and navigate to a specific URL
從 Node.js 啟動預設瀏覽器開啟特定連結的技巧 - 路徑處理函式 path.resolve()、建立目錄 fs.mkdirSync()...
至於圖表部分,Chart.js 還算好上手,我用到幾個技巧:
- Y 軸可以上下堆疊,CPU% 只有 0-100,刻度與每秒請求次數(1)合併的話不易閱讀,我把它移到下方(2)
- 成功回應平均時間高達 35,000,範圍跟每秒請求跟回應數 700 差距更大,故我將平均時 Y 軸放在右側(3),刻度獨立
- Targe 跟 CPU% 使用區塊填色,增加可讀性
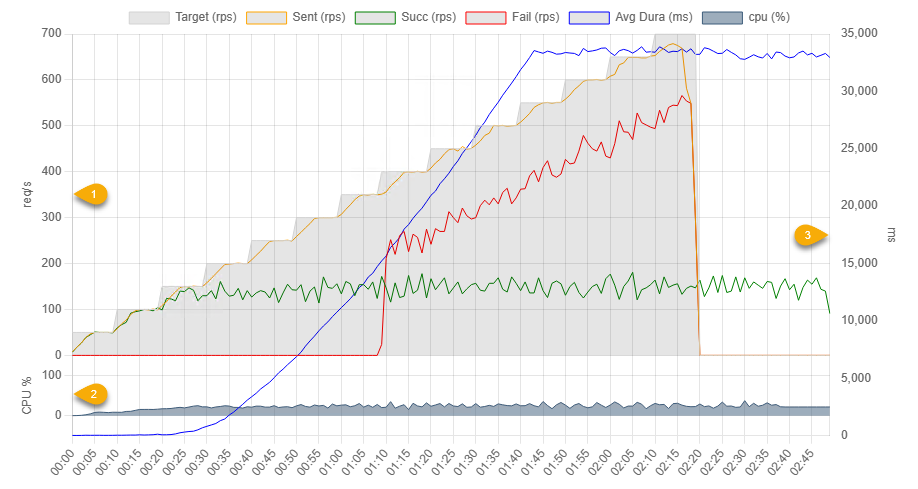
chart.html 內容如下:
<!DOCTYPE html>
<html>

<head>
  <title>K6 Stress Test Chart</title>
  <script src="https://cdn.jsdelivr.net/npm/chart.js"></script>
  <style>
    body {
      width: 90vw;;
      margin: auto;
    }
    .chart-container {
      position: relative;
      width: 100%;
      height: 50vh;
      min-height: 480px;
    }
    span.msg {
      font-weight: bold; color: brown;
    }
    span.times {
      font-size: 0.8em; color: #333;
    }
    #testTime {
      font-size: 0.8em; color: #333; text-align: right; margin-right: 12px;
    }
  </style>
</head>

<body>
  <div>
    <h2>Stress Test</h2>
    <div id="testTime"></div>
  </div>
  <div class="chart-container">
    <canvas id="myChart"></canvas>
  </div>
  <ul id="errList">
  </ul>
  <script>
    function drawChart(data) {
      const chart = new Chart(document.getElementById('myChart').getContext('2d'), {
        type: 'line',
        data: {
          labels: data.labels,
          datasets: data.datasets
        },
        options: {
          animation: false,
          maintainAspectRatio: false,
          scales: {
            y3: { position: 'left', stack: 'left', stackWeight: 1, offset: true, min: 0, max: 100, title: { display: true, text: 'CPU %' } },
            y1: { position: 'left', stack: 'left', stackWeight: 4, title: { display: true, text: 'req/s' } },
            y2: { position: 'right', grid: { display: false }, title: { display: true, text: 'ms' } },
          }
        }
      });
    }
    function listErrors(errors) {
      const ul = document.getElementById('errList');
      const stats = {};
      errors.forEach(e => {
        const [time, msg] = e.split('\t');
        const key = msg.replace(/tcp ([\d.]+):(\d+)->/, "tcp $1:*->")
        if (stats[key]) {
          stats[key].push(time);
        } else {
          stats[key] = [time];
        }
      });
      Object.keys(stats).forEach(msg => {
        const li = document.createElement('li');
        li.innerHTML = `<span class=msg>${msg}</span><br /><span class=times>${stats[msg].join(',')}</span>`;
        ul.appendChild(li);
      });
    }
    function setChartTitle(title, testTime) {
      document.title = title;
      document.querySelector('h2').innerText = title;
      document.getElementById('testTime').innerText = testTime;
    }
  </script>
  <script></script>

</body>

</html>
k6-stress-test-chart.js,我的第一支 Node.js 作品:
const events = require('events'), fs = require('fs'), readline = require('readline'), path = require('node:path');
const argv = require('minimist')(process.argv.slice(2));
const filename = argv._[0] ?? 'result.json';
const title = argv['t'] ?? `Stress Test Report - ${new Date().toLocaleString('en-US')}`;
const chartsDir = argv['d'] ?? 'charts';
if (!fs.existsSync(chartsDir)) fs.mkdirSync(chartsDir);
const htmlPath = path.resolve(chartsDir, argv['f'] ?? `chart-${new Date().toISOString().replace(/[-T:.Z]/g, '')}.html`);

const chartOpt = {
  labels: [], datasets: [],
  addDataSet(label, data, color, fill = false, yAxisID = 'y1', backgroundColor = 'rgba(0,0,0,0.1)') {
    this.datasets.push({
      label, data, borderColor: color, yAxisID, backgroundColor,
      pointRadius: 0, fill, borderWidth: 1, lineType: 'line'
    });
  }
};

let baseTime = undefined;
const perfData = {};
const toHHmmss = d => d.toLocaleTimeString('en-US', { hour12: false });
(async function processLineByLine() {
  try {
    const rl = readline.createInterface({
      input: fs.createReadStream(filename), crlfDelay: Infinity
    });
    const points = {}, errors = [];
    let lineCounts = 0;
    rl.on('line', (line) => {
      lineCounts++;
      if (!line.startsWith(`{"metric":"http_req_duration"`) && !line.startsWith(`{"metric":"checks"`)) return;
      const { tags, time, value: duration } = JSON.parse(line).data;
      const { sentTime, status, target, cpu, time: perfTime } = tags;
      if (cpu !== undefined) { // cpu data
        perfData[perfTime.split('.')[0]] = { cpu: cpu };
        return;
      }
      if (!sentTime) return;
      const logTimeNative = new Date(time), startTimeNative = new Date(sentTime);
      logTimeNative.setMilliseconds(0);
      startTimeNative.setMilliseconds(0);
      if (!baseTime) baseTime = startTimeNative;
      const startTime = toHHmmss(startTimeNative), logTime = toHHmmss(logTimeNative);
      if (!points[startTime]) points[startTime] = new Point(startTimeNative);
      if (!points[logTime]) points[logTime] = new Point(logTimeNative);
      const startTimePoint = points[startTime], logTimePoint = points[logTime];
      startTimePoint.sentCount++;
      if (!startTimePoint.target) startTimePoint.target = target;
      if (status === '200') {
        logTimePoint.succCount++;
        logTimePoint.totalSuccDura += duration;
      } else {
        logTimePoint.failCount++;
        if (!logTimePoint.errCodes[status]) logTimePoint.errCodes[status] = 1;
        logTimePoint.errCodes[status]++;
        if (tags.error) errors.push(`${logTimePoint.timespan}\t${tags.error}`);
      }
      readline.cursorTo(process.stdout, 0);
      process.stdout.write(`${lineCounts.toLocaleString('en-US')} lines processed`);
    });

    process.stdout.write("\x1B[?25l"); //hide cursor when processing
    await events.once(rl, 'close');
    process.stdout.write("\x1B[?25h"); //show cursor

    const sortedPoints = Object.keys(points).sort().map((time) => points[time]);
    const labels = [], sent = [], succ = [], fail = [], targets = [], avgDura = [], cpu = [];
    let lastCpu = 0;
    for (const { timespan, sentCount, succCount, failCount, target, time, avgSuccDura } of sortedPoints) {
      labels.push(timespan);
      sent.push(sentCount);
      succ.push(succCount);
      fail.push(failCount);
      targets.push(target);
      lastCpu = perfData[time]?.cpu ?? lastCpu;
      cpu.push(lastCpu);
      avgDura.push(avgSuccDura);
    }

    chartOpt.labels = labels;
    chartOpt.addDataSet('Target (rps)', targets,'lightgray', true);
    chartOpt.addDataSet('Sent (rps)', sent, 'orange');
    chartOpt.addDataSet('Succ (rps)', succ, 'green');
    chartOpt.addDataSet('Fail (rps)', fail, 'red');
    chartOpt.addDataSet('Avg Dura (ms)', avgDura, 'blue', false, 'y2');
    chartOpt.addDataSet('cpu (%)', cpu, 'rgba(61, 93, 122, 1)', true, 'y3', 'rgba(61, 93, 122, 0.5)');
    let html = fs.readFileSync(path.resolve('.', 'chart.html'), 'utf-8', 'r');
    html = html.replace(
      `<script></script>`,`<script>setChartTitle(${JSON.stringify(title)}, "${baseTime.toLocaleString('en-US')}");
let data=${JSON.stringify(chartOpt)};drawChart(data);
let errors=${JSON.stringify(errors)};listErrors(errors);
</script>`);
    fs.writeFileSync(htmlPath, html);
    console.log(`\n${sortedPoints.length} points saved`);
    var url = `file:///${htmlPath}`;
    var start = (process.platform == 'darwin' ? 'open' : process.platform == 'win32' ? 'start' : 'xdg-open');
    require('child_process').exec(start + ' ' + url);
  } catch (err) {
    console.error(`Error parsing JSON: ${err}`);
    return;
  }
})();

class Point {
  sentCount = 0;
  succCount = 0;
  failCount = 0;
  target = 0;
  totalSuccDura = 0;
  get avgSuccDura() {
    return this.succCount ? Math.round(this.totalSuccDura / this.succCount) : 0;
  }
  errCodes = {};
  constructor(time) {
    this.time = toHHmmss(time);
    this.timespan = new Date(time - baseTime).toUTCString().match(/\d\d:(\d\d:\d\d)/)[1];
  }
}
效果如何呢?實際看操作影片比較有 fu:
在影片中,我分別測試了 /Registration/TestJson (純 POST JSON 參數物件及取得 JSON 回應物件) 及 /Registration/Register (純 POST JSON 參數物件,寫入 SQLite DB、傳回 JSON 回應物件),過程只修改 CLI 參數而已,一氣喝成完成兩次測試,並得到兩張壓測結果報表,
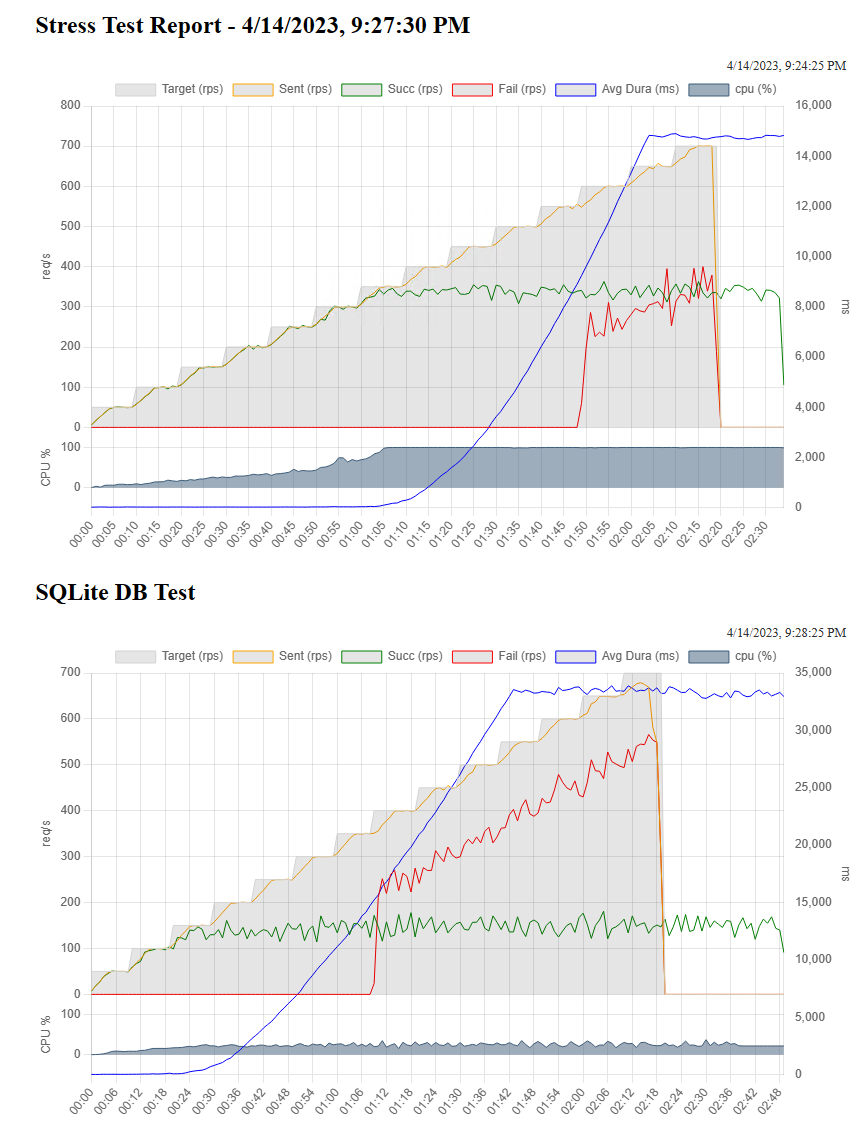
二者對照可看出明顯差異,串接 DB 後,CPU 無法提升到 100%,最高就到 35% 左右,但因為要排隊寫進資料庫,Throughput 最高只到 180 RPS 就升不上去,大約 1:08 左右 503 大量出現,最高達到 550 次/秒。由於每秒能消化的請求數上限不到 200 RPS (未串 DB 時約 330 RPS),Stage 跑完還在慢慢消化排隊的請求,而請求平均完成時間也高達 33 秒左右(未串 DB 時為 14.5 秒)。串接壓力測試與之前的測試相比,形態上有所不同,可視為瓶頸非 CPU 而是等待 I/O 的典型範例。
有了好用工具跟簡便的測試程序,之後要做效能調校就方便了。
To simplify the stress test process and quickly generate charts, I used Node.js and Chart.js to create a set of tools for fast testing and charting.
Comments
# by kaba
高手
# by Sam Lin
just found this https://github.com/szkiba/xk6-dashboard#download