K6 壓力測試練習 - 壓測同時蒐集 CPU 使用率
| | | 0 | |
開始前先聲明,要將 K6 測試結果繪成圖表,官方其實有建議做法,例如:
使用 K6 Clound

或串接 InfluxDB/TimescaleDB/Prometheus 整合 Grafana 分析監控面板。

K6 有提供支援套件與相關說明,透過一些安裝設定就有現成的精美報表可用。
相較之下,我這幾篇文章分享的屬另類土砲做法,強調輕巧易用不依賴第三方軟體或服務,功能陽春且品質略為粗糙,旨在追求自己造輪子及能 100% 客製的樂趣,讀者們請斟酌參考,閱讀過程如有不適,請即關閉瀏覽器並大量飲水。
【本文開始】
昨天分享了用 36 行 C# 寫的 CPU、RAM、Disk 效能監視 WebAPI,目的是想整合到 K6 壓力測試 JavaScript 程式,在壓測的同時每秒讀取一次 CPU 使用率,設法寫入結果 JSON 檔,稍後解析程式可跟測試資料一併取出畫成圖表。可以想見,這個做法存在一個問題 - 當目標主機 CPU 100% 時,讀取 CPU 狀態的 HTTP Request 可能也會延遲或無回應,出現數據落後或缺資料的狀況,但基於 CPU 數字只供參考,知道約略趨勢即可,忽略不處理也無妨。
整理我用到的技巧:
- 同時開兩個 Scenario
一個設 ramping-arrival-rate 逐步加壓進行壓力測試。(參考 挑戰網站極限,逼出 HTTP 503)
另外再設一個 constant-arrival-rate設定每秒一次查詢 CPU、RAM、Disk 效能監視 WebAPI 讀取 CPU 使用率或其他想觀察的數據。
兩個 Scenario 的結果都會寫入 result.json,後續再寫程式進行分析。export const options = { systemTags: ['status','error'], scenarios: { stress: { executor: 'ramping-arrival-rate', preAllocatedVUs: 10000, timeUnit: "1s", stages: stages }, monitor: { executor: 'constant-arrival-rate', preAllocatedVUs: 1, timeUnit: "1s", rate: 1, // 每秒執行一次 // 由 stages 時間總長度加 20 秒當執行時間 duration: 20 + stages.length * 5 + 's', exec: 'monitor' // 執行名為 monitor 的函式 } } }; export function monitor() { let res = http.get(`http://10.8.0.6:5000`); // 取得 typeperf 資料的 WebAPI } - CPU 數字結果要怎麼放入 result.json?
我選擇的做法是在 check 時由 res.body 取得效能計數器字串 (例如:21:19:34.572,99.762670,4.880612,0.000000),取出 CSV 第一、二欄位分類填入 time 及 cpu Tag,則 result.json 的記錄將變成:{"metric":"checks","type":"Point","data":{"time":"2023-04-12T21:19:35.7013845+08:00","value":1,"tags":{"cpu":"99.762670","time":"21:19:34.572"}}}
monitor() 函式修改如下,在 check() 加上物件指定自訂 Tag 值:export function monitor() { let res = http.get(`http://10.8.0.6:5000`); check(res, { 'status is 200': (r) => r.status === 200 }, { cpu: res.body.split(',')[1], time: res.body.split(',')[0] }); }
以下是完整的 stress.js:
import http from 'k6/http';
import { sleep, check } from 'k6';
import { getCurrentStageIndex } from 'https://jslib.k6.io/k6-utils/1.3.0/index.js';
import exec from 'k6/execution';
const stages = [];
for (let t = 50; t <= 800; t += 50) {
stages.push({ duration: '5s', target: t }, { duration: '5s', target: t });
}
const stats = { cpu: -1 };
export const options = {
systemTags: ['status','error'], //,'vu','iter'
scenarios: {
stress: {
executor: 'ramping-arrival-rate',
preAllocatedVUs: 10000,
timeUnit: "1s",
stages: stages
},
monitor: {
executor: 'constant-arrival-rate',
preAllocatedVUs: 1,
rate: 1,
duration: 20 + stages.length * 5 + 's',
timeUnit: "1s",
exec: 'monitor'
}
}
};
const jsonPayload = `{
"LotteryUid":"b1a2bef2-0951-48c1-b97b-4a8988447c15",
"SoldTime":"2023-04-04T23:58:44.287528+08:00",
"RetailerId":"0000",
"Numbers":"AQgCAwUN",
"MegaNumber":7,
"ReqSign":"jcGK37pXuW9bGTKJ7/bmDSTuROx3TY/H31USgGtRfkc7pYFkFDoNg9XwJc7g9dUSBSEOWK7WCDJMDL8VlEn8OBttFTVgDc9nTPZpASdUawFJXhmLRgb7AVG5iWNsbxAAaDLW5yDEOEjzWsMpA5dukMJN6RHUUHfuVkux60nE240="
}`;
export default function() {
let res = http.post(`http://10.8.0.6/Registration/TestJson`, jsonPayload, {
tags: {
timestamp: new Date().toISOString(),
target: stages[getCurrentStageIndex()].target
},
headers: { 'Content-Type': 'application/json' }
});
check(res, {
'status is 200': (r) => r.status === 200
});
}
 export function monitor() {
     let res = http.get(`http://10.8.0.6:5000`);
     check(res, {
         'status is 200': (r) => r.status === 200
     }, { cpu: res.body.split(',')[1], time: res.body.split(',')[0] });
 }
測試時可以看到 monitor 與 stress 雙軌並行,monitor 的結果也會寫入 result.json。

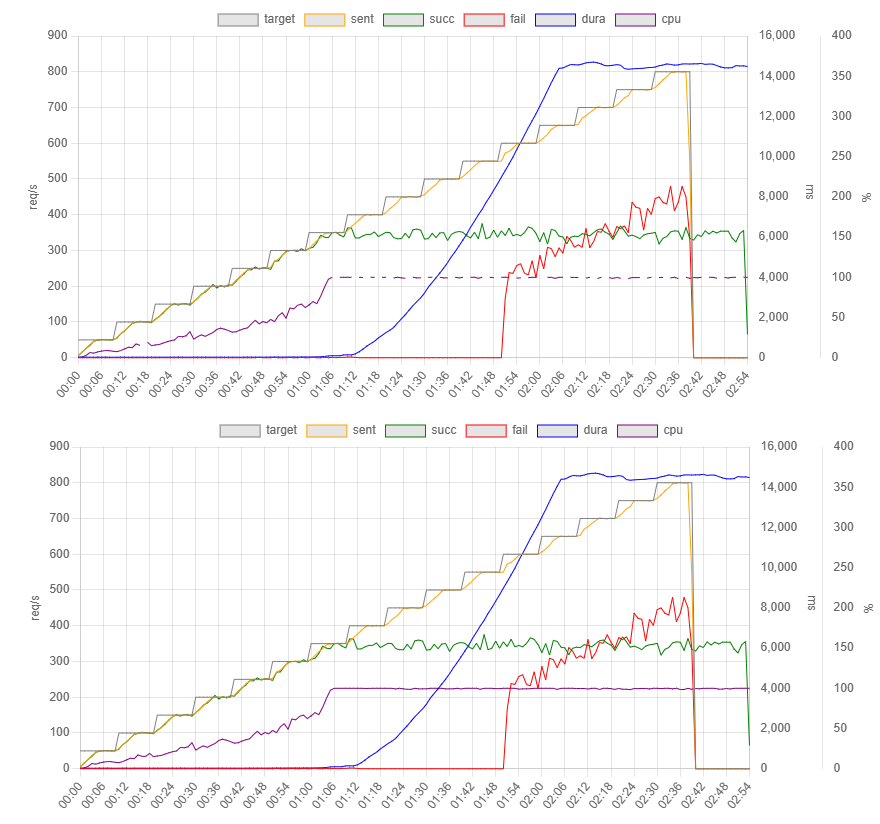
下面是將 CPU 數據整合到測試圖表的效果,上面的圖是未校正的原始資料,一如預期,紫線在 1:06 達到 CPU 100% 後斷斷續續,但並不影響判讀,不處理也無妨。下面的圖則試著加了一小段補資料邏輯:遇到 CPU 數據遺失時補上前一秒的數字,修補效果很不錯。
從 WebAPI 取回 CPU 使用率混入 K6 測試資料的構想,做法簡單,報表效果也不錯,測試成功。而這個技巧也能用來串接其他效能監視 WebAPI,例如 Azure Metrics REST API,整合不同資料來源,再開啟一條擴充管道。
Try to collect CPU performance counters via WebAPI while running K6 load testing and integrate them into result json file.
Comments
Be the first to post a comment