Windows CPU/RAM/Disk 效能監視 CLI 工具 - typeperf
| | | 0 | |
講到在 Windows 觀察 CPU、RAM 跟硬碟... 等效能數據,大家應該會馬上想到效能監視器(Performance Monitor)。
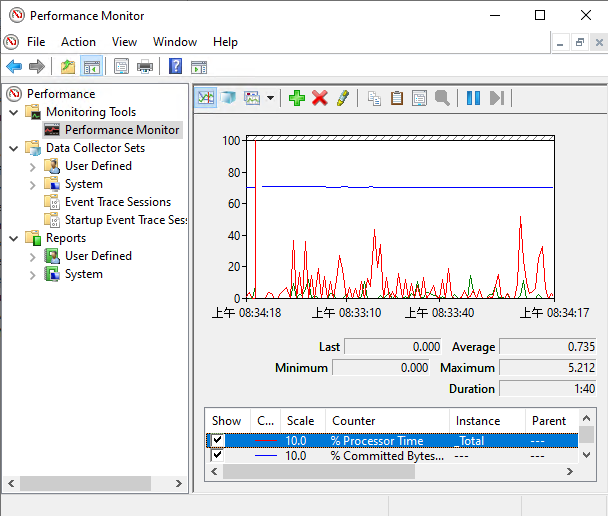
效能監視器也提供寫入 Log 長期監控的功能,但我不想動用 GUI,打算全靠 CLI 指令搞定。
原以為需要第三方軟體或自己用 PowerShell 寫,意外發現 Windows 有內建工具 - typeperf。
用法超簡單,傳入計數器(Performance Counter)名稱當參數 typeperf "\Processor(_Total)\% Processor Time",程式便會一秒一次以 CSV 格式輸出 CPU 使用率。加上 -si 5 -sc 50 可指定每五秒取樣一次,取樣 50 次,加上 -f TSV -o cpu.log 可將結果存成 Tab 分隔文字檔。
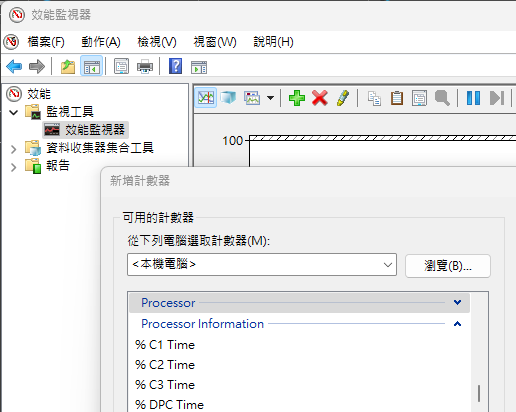
計數器名稱可用效能監視器工具查詢:
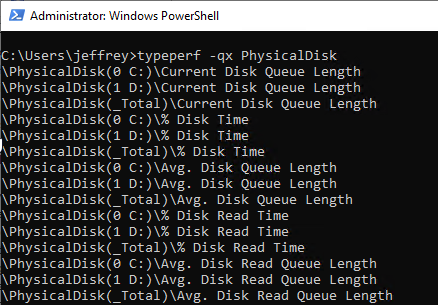
或是 typeperf -qx PhysicalDisk 下指令查詢:
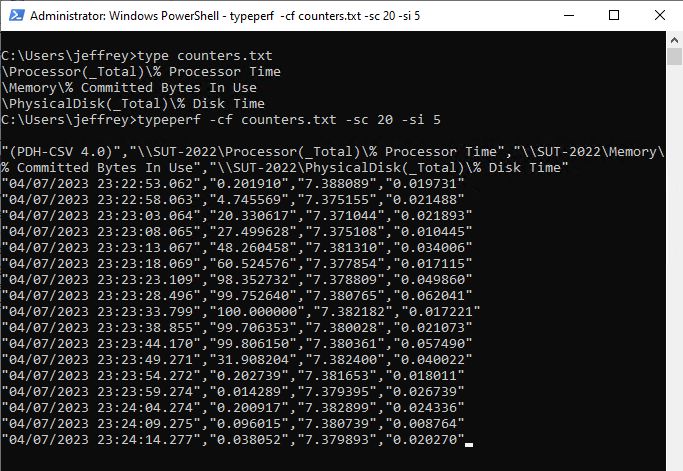
若要一次監控多組計數器,將可一列一筆存成 .txt 檔,例如我將 CPU 使用率、記憶體使用比例、硬碟運轉時間比例等計數器存成 counters.txt:
\Processor(_Total)\% Processor Time
\Memory\% Committed Bytes In Use
\PhysicalDisk(_Total)\% Disk Time
使用指令 typeperf -cf counters.txt -sc 20 -si 5 便能五秒記錄一次 CPU、RAM、Disk 的使用狀況,20 筆後結束。(下圖監測期間間涵蓋了一次壓力測試,故可觀察到 CPU 由 0% 上升到 100% 再降回 0% 的過程)
實際應用時可再加上 -o perf.log(CSV 格式) 或 -f TSV -o perf.log(Tab 分隔)將結果存成文字檔,不管要匯入資料庫、Excel 或寫程式整合,都非常方便,大推。
This article introduces how to use typeperf to collect Windows CPU, memory, disk and other performance data and save them as CSV for later use.
Comments
Be the first to post a comment