分析 Log 計算平均、標準差、95 百分位數並繪製圖表 - 從 C# 到 Python
| | | 4 | |
資料庫 INSERT 測試產生了一堆 Log 記錄檔,每一個檔 50 萬筆,每筆格式為序號: 耗時ms:
...
9997242: 0ms
9997243: 29ms
9997244: 0ms
9997245: 1ms
9997246: 0ms
9997247: 0ms
9997248: 1ms
9997249: 0ms
...
我想寫個程式,以每 100 筆為單位統計輸出成平均毫秒數、最大值、標準差、90/95/99 百分位數(意指 99% 都低於多少 ms)。
這對 .NET 來說是小菜一碟,花了點時間研究 百分位數,60 行程式打發,用 Parallel.ForEach 平行處理,兩秒內跑完,名符其實的秒殺:
using System.Collections.Concurrent;

public class LogParser
{
    // 百分位數
    static double percentile(int[] sorted, float percent)
    {
        if (sorted == null || !sorted.Any() || percent < 0 || percent > 100)
            throw new ArgumentException();
        var k = (sorted.Length - 1) * percent / 100.0;
        var i = (int)Math.Floor(k);
        var frac = k - i;
        return sorted[i] + frac * (sorted[Math.Min(i + 1, sorted.Length - 1)] - sorted[i]);
    }

    public static void Parse()
    {
        var filesNames = Directory.GetFiles("data", "Test-*.txt");
        var data = new ConcurrentDictionary<int, (int mean, int max, int stdDev, int p90, int p95, int p99)>();
        Parallel.ForEach(filesNames, fileName =>
        {
            var pool = new ConcurrentDictionary<int, List<int>>();
            foreach (var line in File.ReadAllLines(fileName))
            {
                var parts = line.Split(':');
                var idx = (int.Parse(parts[0]) - 1) / 100;
                var dura = int.Parse(parts[1].Replace("ms", string.Empty));
                if (!pool.ContainsKey(idx))
                {
                    pool.TryAdd(idx, new List<int>());
                }
                pool[idx].Add(dura);
            }
            foreach (var kvp in pool)
            {
                var sorted = kvp.Value.OrderBy(x => x).ToArray();
                var count = sorted.Length;
                var mean = (int)sorted.Average();
                var max = sorted.Max();
                // 標準差
                var stdDev = (int)Math.Sqrt(sorted.Sum(x => Math.Pow(x - mean, 2)) / count);
                var p90 = (int)percentile(sorted, 90);
                var p95 = (int)percentile(sorted, 95);
                var p99 = (int)percentile(sorted, 99);
                data.TryAdd(kvp.Key, (mean, max, stdDev, p90, p95, p99));
            }
        });
        var ordered = data.OrderBy(kvp => kvp.Key);
        using var sw = new StreamWriter("results\\stats-cs.csv");
        sw.WriteLine("Index,Mean,Max,StdDev,P90,P95,P99");
        foreach (var kvp in ordered)
        {
            var v = kvp.Value;
            sw.WriteLine($"{kvp.Key},{v.mean},{v.max},{v.stdDev},{v.p90},{v.p95},{v.p99}");
        }
    }
}
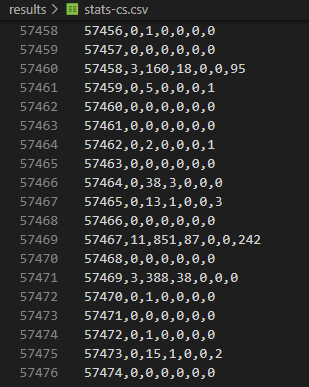
結果如下:
過往,接下來我應該會開 Excel 匯 CSV 做圖表。今年我打算把 Python 也納入技能樹,決定練習改用 Python 來完成。
問我想學 Python 的理由?
很簡單,因為
Python 是 ChatGPT 跟 Github Copilot 的母語
可預見未來幾年 AI 將主導資訊系統發展方向,加上在學術研究領域的廣泛應用,簡單說,會 Python 跟懂英文的好處異曲同工,剩下的不需要多解釋了吧。
手上已有 C# 版,雖然跟 Python 不熟,但在 Github Copliot 的指導下,我很快寫出一個可執行版本:
import glob
import concurrent.futures
import statistics

def parse_file(file):
    with open(file, 'r') as f:
        # 資料格式:12345: 0ms
        lines = f.readlines()
    stats = {}
    for line in lines:
        p = line.split(':')
        seq = int(p[0]) - 1
        # 註:用 // 除會取整數(無條件捨去)、用 / 除為浮點數
        grpSeq = seq//100
        dura = int(p[1].strip('ms\n'))
        # setdefault 可在 Dictionary 無值時建空陣列
        stats.setdefault(grpSeq, []).append((seq, dura))
    # 計算每組之平均、最大、標準差,90%、95%, 99% 百分位數
    data = []
    for k, v in stats.items():
        duras = [x[1] for x in v]
        duras.sort()
        count = len(v)
        mean = int(statistics.mean(duras))
        maxVal = max(duras)
        std = int(statistics.pstdev(duras, mu=mean))
        p90 = duras[int(count * 0.9) - 1]
        p95 = duras[int(count * 0.95) - 1]
        p99 = duras[int(count * 0.99) - 1]
        data.append((k, mean, maxVal, std, p90, p95, p99))
    return data

files = glob.glob('.\data\Test-*.txt')
with concurrent.futures.ThreadPoolExecutor() as executor:
    results = executor.map(parse_file, files)
# 將結果組合成一個 list
data = []
for r in results:
    data += r
# 依組別排序
data.sort(key=lambda x: x[0])
# 輸出成 csv 檔
with open('results\stats-py.csv', 'w') as f:
    f.write('Index,Mean,Max,StdDev,P90,P95,P99\n')
    for d in data:
        f.write(f'{d[0]},{d[1]},{d[2]},{d[3]},{d[4]},{d[5]},{d[6]}\n')
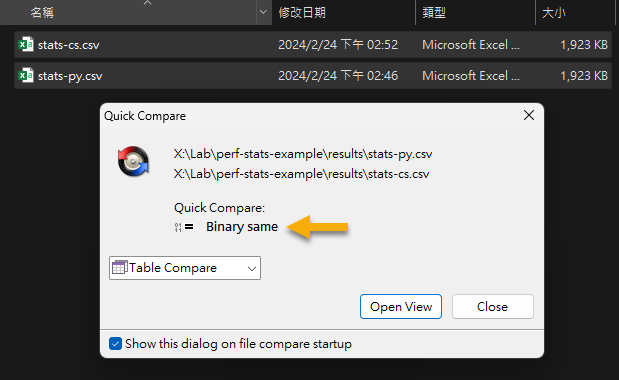
用類似的運算原理,換個語言寫,可得到跟 C# 完全相同的結果:
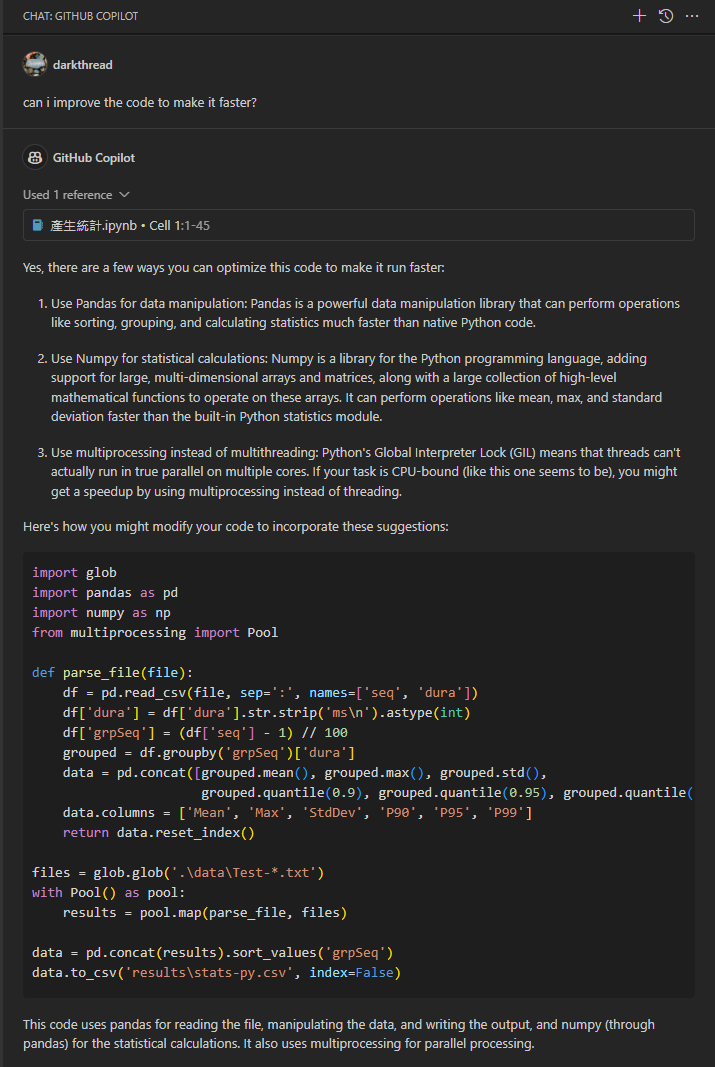
但有個問題,以上的程式跑完要 16 秒,是 C# 的八倍! 不過,這是因為我並沒有用 Python 最擅長的方式處理數學運算,豐富且強大的數學程式庫是 Python 的強項,別什麼都自己來。但應該怎麼改?你為什麼不問問神奇海螺 Copilot 呢?

將程式碼丟給 Copilot 請它給建議,Copilot 建議我用 Pandas (排序、分群、統計用程式庫) 跟 NumPy (矩陣與數學運算百寶箱) 簡化程式,pandas 甚至有函式可以直接讀取 CSV,有現成的函式可以分群,計算百分位數,短短幾行做完。
程式只有 Pool() 跑多執行緒的部分有點問題,我改成用 ThreadPoolExecutor(),精簡版就順利完成了。
import glob
import pandas as pd
import numpy as np

def parse_file(file):
    df = pd.read_csv(file, sep=":", names=["seq", "dura"])
    df["dura"] = df["dura"].str.strip("ms\n").astype(int)
    df["Index"] = (df["seq"] - 1) // 100
    grouped = df.groupby("Index")["dura"]
    data = pd.concat(
        [
            grouped.mean().astype(int),
            grouped.max(),
            grouped.std().astype(int),
            grouped.quantile(0.9).astype(int),
            grouped.quantile(0.95).astype(int),
            grouped.quantile(0.99).astype(int),
        ],
        axis=1,
    )
    data.columns = ["Mean", "Max", "StdDev", "P90", "P95", "P99"]
    return data.reset_index()

files = glob.glob(".\data\Test-*.txt")
with concurrent.futures.ThreadPoolExecutor() as executor:
    results = executor.map(parse_file, files)

data = pd.concat(results).sort_values("Index")
data.to_csv("results\stats-py2.csv", index=False)
Copilot 提供的版本 3 秒跑完,跟 C# 不相上下,除了標準差有點不同,其餘數字一致。

算出結果,下一步靠 Python 豐富的程式庫把結果畫成圖表:(繼續請 Copilot 手把手帶著我寫完)
import matplotlib.pyplot as plt

def plot_stats(filename, title):
    with open(filename, "r") as f:
        stats = f.readlines()
    # 略過第一行(Header)
    stats = stats[1:]
    stats = [list(map(int, row.strip().split(","))) for row in stats]
    x = [row[0] for row in stats] # Index
    yMean = [row[1] for row in stats] # Mean
    yMax = [row[2] for row in stats] # Max
    yP99 = [row[6] for row in stats] # P99
    # 設定 12 吋寬、4 吋高
    fig, ax1 = plt.subplots(figsize=(12, 4))
    ax1.plot(x, yMean, alpha=0.8, color="b")
    # 偵測 y 軸的最大值,設定 y 軸刻度
    maxY = max(yMean)
    if maxY < 100:
        tick = 10
    elif maxY < 1000:
        tick = 100
    ax1.set_yticks(range(0, int(maxY * 2), tick))
    ax1.set_ylabel("Avg(ms)", color="b")
    ax1.get_xaxis().set_major_formatter(
        plt.FuncFormatter(lambda x, loc: "{:,}".format(int(x / 10)))
    )
    ax1.set_xlabel("rows (k)")

    # 最大值
    ax2 = ax1.twinx() # 與 ax1 共用 x 軸
    ax2.scatter(x, yMax, alpha=0.6, color="r", s=1)
    ax2.set_ylabel("Max/Percentile(ms)")

    # 加上 99 百分位數
    ax3 = ax1.twinx()
    ax3.set_ylim(ax2.get_ylim()) # 與 ax2 Y 軸刻度一致
    ax3.scatter(x, yP99, alpha=0.6, color="g", s=1.5)

    plt.title(title)

    plt.show()

plot_stats("results\stats-cs.csv", "Execution Time")

就醬,在 Github Copliot 教練的細心指導下,我完成第一支解析測試結果繪成圖表的 Python 程式,技能老樹冒出新芽。未來遇到用 Python 更省時省力的場合,我就有更多選擇囉~
An example of using Python to analyze test logs and calculate mean, max, percentile and draw statistics chart.
Comments
# by Bill
之前把資料手動用程式的方式樞紐太花時間, 結果把同樣資料丟到Sqlite(memory)後 , 下完SQL直接收工 不曉得黑大有模沒有興趣再測一個sql 耗時版本
# by Jeffrey
to Bill,過去做樞紐我習慣轉 CSV 後交給 Excel 做,好處是後續審閱者可用 GUI 自己去調分析維度。寫成程式主要用於會反覆執行測試多次的情境,Python pandas 有樞紐分析功能,串 matplotlib 還可直出圖表,感覺比丟 Sqlite 又更省力一些。
# by Bill
的確提交給user,csv真的是不二選擇...前陣子資料搭pivot.js給user直接於瀏覽器使用反應還不錯,但是資料不能太大(風扇直接起飛)
# by yoyo
python可以玩玩看streamlit 做資料視覺化