.NET 首次執行偏慢現象之 JIT 編譯效應觀察
 |  | 0 |  |  |
.NET 效能測試首次執行偏慢現象解析一文得到老讀者 Lane Kuo 的迴響,補充一篇好文:.NET Just in Time Compilation and Warming up Your System by Abhinaba Basu,一掃我對 .NET JIT 編譯的迷思。
.NET 的 dll/exe 以 CIL 通用中間語言方式儲存程式碼,真正要執行前才將 CIL 進一步編譯成適用該主機硬體的機器程式碼(Machine Code),這個特性稱之為 JIT,Just In Time,編譯。但我一直以為 JIT 是發生在 Process 載入 Assembly 之際,看到 Abhinaba 用 windbg 證明「.NET 的 JIT 即時編譯是以方法為單位」才恍然大悟,.NET Runtime 會拖到真的要執行該方法前才執行 JIT 編譯,這策略基於成本效益,沒用到的東西就不花時間準備,合情合理。
也因為我原本以為 JIT 編譯在載入 Assembly 階段就完成了,故在分析首次執行偏慢原因時並未將 JIT 編譯因素納入考量,得知它以方法為單位,顯然該重啟調查。
要克服 JIT 編譯延遲,有三種做法:
- 使用 NGen 預先編譯
- 強迫該方法預先進行 JIT 編譯 System.Runtime.CompilerServices.RuntimeHelpers.PrepareMethod()
- 預先執行該方法暖身(就是前文使用的技巧)
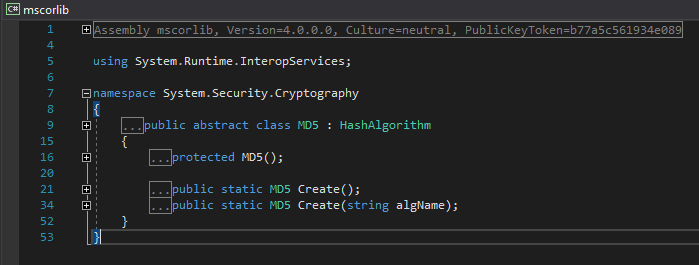
本案例測試對象 MD5/SHA1 隸屬 System.Security.Cryptography 位於 mscorlib.dll。
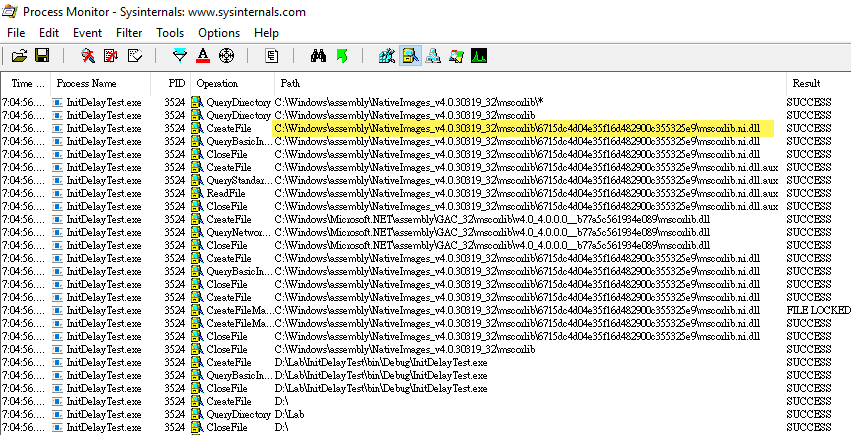
mscorlib 為 .NET 核心組件,基於效能考量在安裝 .NET Framework 時應已做過 NGen。使用 Performance Monitor 觀察可發現測試程式實際存取 C:\Windows\assembly\NativeImages_v4.0.30319_32\mscorlib\ \mscorlib.ni.dll 可為佐證:
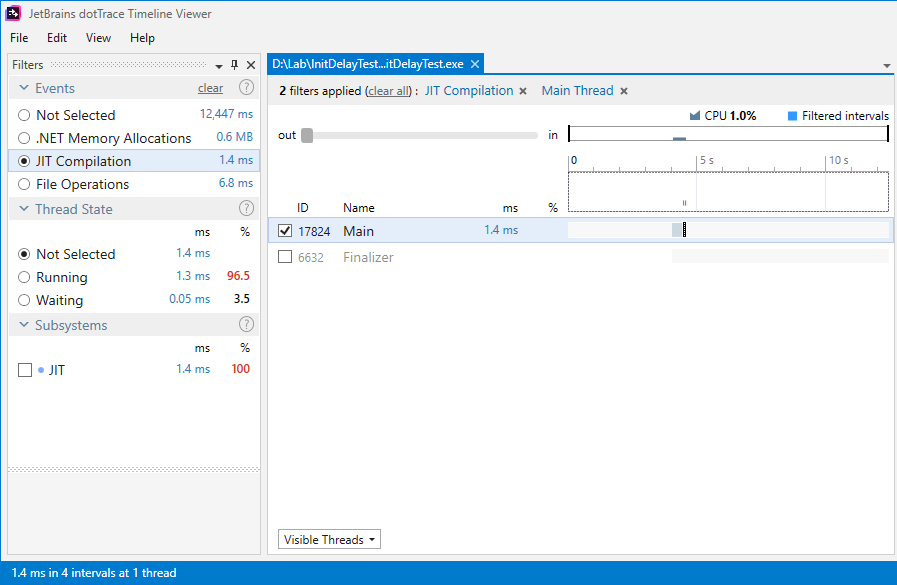
由此推測,MD5/SHA1/SHA256 等應不致受 JIT 編譯拖累。dotTrace 工具有個 Timeline Profiling 功能可觀察 JIT 編譯時間,以前篇文章的 TestMD5_First(); TestMD5_Second(); 程式為對象,測量總執行時間為 12.4ms,其中 JIT 編譯時間只佔 1.4ms。
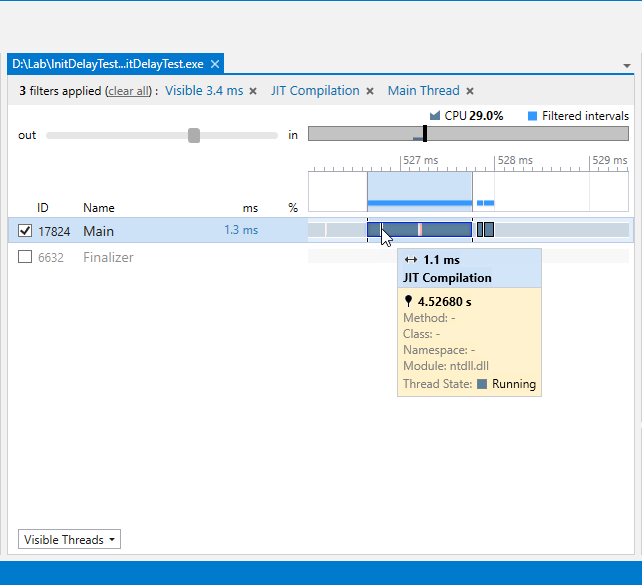
展開時間軸,觀察到的 JIT 編譯發生在 clr.dll、ntdll.dll、wow64cpu.dll、Program.cs Main(),未包含 mscorlib.dll,符合 Performance Monitor 記錄存取的已編譯版(Native Image)只有 mscorlib.ni.dll,其餘 clr.dll、ntdll.dll、wow64cpu.dll 都是 CIL 版。
實驗至此,應可排除 JIT 編譯造成本案例首次執行偏慢的假設。
不過我還是做了測試,呼叫 System.Runtime.CompilerServices.RuntimeHelpers.PrepareMethod() 先準備 InitializeConfigInfo() 再執行。
static void Main(string[] args)
{

    Test(() =>
    {
        MethodInfo mi =
            typeof(CryptoConfig).GetMethod("InitializeConfigInfo",
                BindingFlags.Static | BindingFlags.NonPublic);
        System.Runtime.CompilerServices.RuntimeHelpers.PrepareMethod(mi.MethodHandle);
    }, "InitializeConfigInfo JIT Compilation");
    Test(() =>
    {
        MethodInfo mi =
            typeof(CryptoConfig).GetMethod("InitializeConfigInfo",
                BindingFlags.Static | BindingFlags.NonPublic);
        mi.Invoke(null, null);
    }, "\nInitializeConfigInfo Exec");

    Console.WriteLine();
    var flag = args.Length > 0 ? args[0] : "1";
    switch (flag)
    {
        case "1":
            Test1();
            Test1();
            break;
        case "2":
            Test2();
            Test2();
            break;
        case "3":
            Test3();
            Test3();
            break;
    }
}
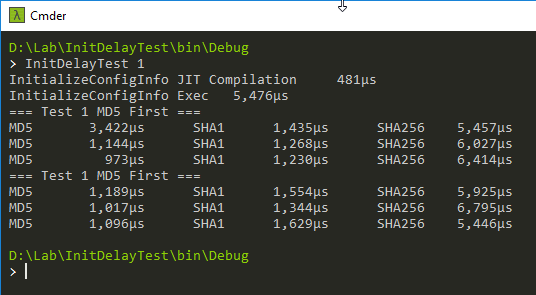
實測結果挺有趣,PrepareMethod() 耗時 0.5ms,InitializeConfigInfo() 執行時間則由上篇文章的 6ms 降到 5.5ms,減少的時間差不多就是 PrepareMethod() 耗費的時間。
InitializeConfigInfo() 位於 mscorlib.dll,已是 JIT 編譯後版本,為什麼 PrepareMethod() 還是有加速效果? 這問題遠超過我對 .NET Runtime 的理解,只能依據官方文件推敲:
Compilers use the PrepareMethod(RuntimeMethodHandle) method to handle virtual calls that are made inside a constrained execution region (CER). At JIT compilation time, the common language runtime does not usually have enough information about the target of a virtual call. Therefore, the runtime does not initially prepare that segment of the call graph. If the code that is using the CER has enough knowledge to determine the target at any point in time before the CER is actually entered, it can call PrepareMethod(RuntimeMethodHandle) to perform the same runtime preparation normally done for a CER rooted at the method specified as an argument.
裡面提到 PrepareMethod 可供在 JIT 編譯階段讓 .NET Runtime 準備好虛擬呼叫對象的 Call Graph 以便在進入 CER 時應用。猜想其中除了 JIT 編譯外還包含其他準備工作,才讓正式呼叫時加快 0.5ms。但以上純屬門外漢瞎猜,留待各方高人補充指正。
歸納本次的研究心得:
- .NET JIT 編譯發生各方法呼叫前,而非我原以為的 Assembly 載入時
- NGen 或 RuntimeHelpers.PrepareMethod() 可強迫預先 JIT 編譯
- 本案例用到的 mscorlib.dll 已做過 NGen,配合實測觀察,JIT 編譯不是首次執行偏慢主因
- dotTrace Timeline Profiling 可用於觀察 JIT 編譯耗時比例
- 即使已經過 JIT 編譯,RuntimeHelpers.PrepareMethod() 仍有加速效果
最後補充,本案例因 mscorlib.dll 已經過 NGen 避開 JIT 編譯的效能影響,故不適合用來推論 JIT 編譯對實務程式的影響,不過現在對原理有了基本認識,也學會觀察工具以及克服方法,倒不難設計實驗觀察 JIT 編譯對效能的影響,就排入 TODO 清單吧。
The article demostrates how to use Perfromance Monitor to check if the assembly had been NGen, use dotTrace to observe JIT compilation time and test if PrepareMethod() can imporve performance.
Comments
Be the first to post a comment