為 ASP.NET 加入自訂 PRTG 指標
 |  | 1 |  |  |
PRTG (Paessler Router Traffic Grapher) 是德國 Paessler 公司開發的 Windows 網路監控軟體,提 供友善易用的圖表介面,可用來監控各式網路設備,如路由器、交換機、防火牆、伺服器等,同時也能監控各種應用和服務,如網站、資料庫、郵件伺服器等。監控指標涵蓋 CPU 使用率、記憶體用量、頻寬、延遲時間... 等等,也能設定觸發條件,在系統異常時主動發送警報和通知,並有定期報表,該有的功能都有。
講到系統監控,ElasticSearch + Logstach + Kibana (ELK) 跟 Prometheus + Grafana 算是當今主流,其功能及擴充性固然強大,但架設與管理的複雜度也不容小覻。對於監看系統數字 + 異常警報的單純應用,動用牛刀大隆重了。與 ELK 或 Grafana 相比,PRTG 相對簡單易用許多,會是個不錯的替代選擇。它有以下優點:
- 從安裝設定到開始監控只需幾分鐘,網頁操作介面夠直覺,不難上手
- 新增設備、加入 Sensor 到產生圖表在網頁上只需幾個步驟即可完成
- 自帶資料庫,完全不需設定與管理,歷史資料會自動彙整兩天、30 天、365 天統計
- 若管理的設備及系統不多,100 個 Sensor 以下可使用 Freeware Edition,免費用於私人或商業用途(Free for personal and commercial use)
除了數百種現成 Sensor,PRTG 也支援自訂 Sensor,只要提供符合規格的 XML 或 JSON 格式,我們也可以自訂 Sensor,讓 PRTG 除了監控 CPU、RAM、Disk、網路設備外,還能監控網站線上人數、每分鐘交易筆數... 等各式自訂指標,只要你統計得出來,就能放進 PRTG 監控。
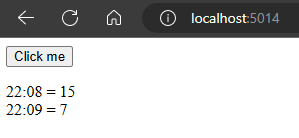
這篇文章就來試玩一下,我用 ASP.NET Core Minimal 寫了一個無聊的統計,統計每分鐘 Button 被按了幾次。用 ConcurrentDictionary 保存目前跟前一分鐘的統計數字,每次按鈕時 POST 讓當下分的鐘計數器加一,監看數字則抓前一分鐘的次數統計(不再變動)。超過兩分鐘的資料理應設排程或定期器清除較有效率,展示用途為求方便,我選擇在讀取資料時順便清除。
using System.Collections.Concurrent;

var builder = WebApplication.CreateBuilder(args);
var app = builder.Build();

app.MapGet("/", () => Results.Content($@"
<!DOCTYPE html>
<html><head><title>ASP.NET Core</title></head>
<body>
<form method=""post"">
    <button>Click me</button>
    <p>
        DEBUG INFO: <br />
        {Stats.LastKey} = {Stats.GetData()}<br/>
        {Stats.CurrKey} = {Stats.GetRealTimeData()}<br/>
    </p>
</form>
</body></html>
", "text/html"));
app.MapPost("/", () =>
{
    Stats.Increment();
    return Results.Redirect("/");
});

app.Run();

public static class Stats
{
    static string ToHHmm(this DateTime time) => time.ToString("HH:mm");
    //只保留目前與前一分鐘的資料
    static ConcurrentDictionary<string, int> stats = new ConcurrentDictionary<string, int>();
    public static string CurrKey => DateTime.Now.ToHHmm();
    public static string LastKey => DateTime.Now.AddMinutes(-1).ToHHmm();
    public static void Increment() =>
        stats.AddOrUpdate(CurrKey, 1, (key, value) => value + 1);
    public static int GetData()
    {
        //clear old stats
        stats.Keys.Where(o => o != CurrKey && o != LastKey).ToList()
            .ForEach(o => stats.TryRemove(o, out int _));
        return stats.TryGetValue(LastKey, out int value) ? value : 0;
    }
    public static int GetRealTimeData() =>
        (stats.TryGetValue(CurrKey, out int value)) ? value : 0;
}
接著,試著將統計資料轉成 PRTG 所需的格式。要串接 Web API,有個 HTTP Data Advanced Sensor 可呼叫 HTTP 取得 XML/Json,其中可以包含多組計量數字(以 Channel 為單位,而且 Channel 資料只算一個 Sensor),資料格式範例如下:
<prtg>
    <result>
        <channel>First channel</channel>
        <value>10</value>
    </result>
    <result>
        <channel>Second channel</channel>
        <value>20</value>
    </result>
</prtg>
{
  "prtg": {
   "result": [
      {
        "channel": "First channel",
        "value": 10
      },
      {
        "channel": "Second channel",
        "value": 20
      }
    ]
  }
}
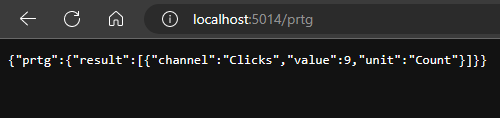
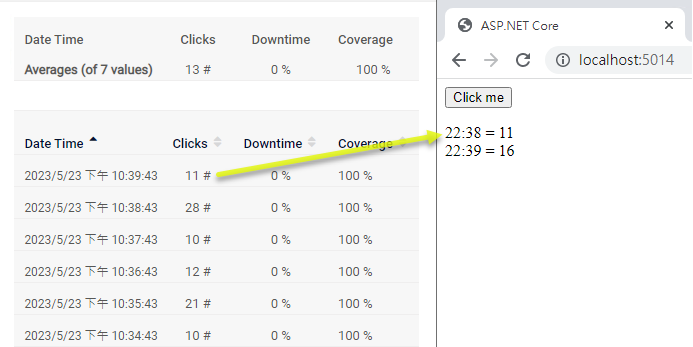
為此,我們在 ASP.NET Core 加入一個 Get("/prtg") 傳回 JSON,channel 名稱為 Clicks,由 Stats.GetData() 傳回上一分鐘次數統計,單位則用 Count:
app.MapGet("/prtg", () => new {
    prtg = new {
        result = new [] {
            new {
                channel = "Clicks",
                value = Stats.GetData(),
                unit = "Count"
            }
        }
    }
});
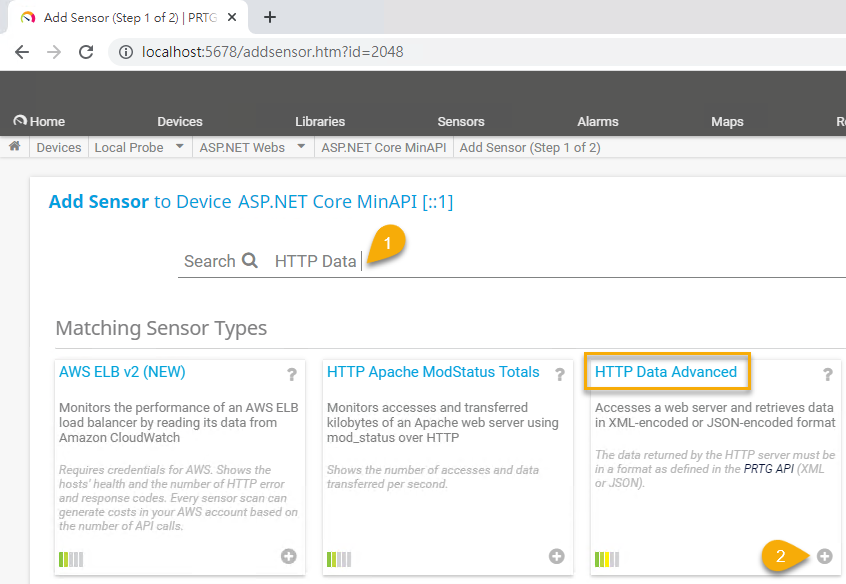
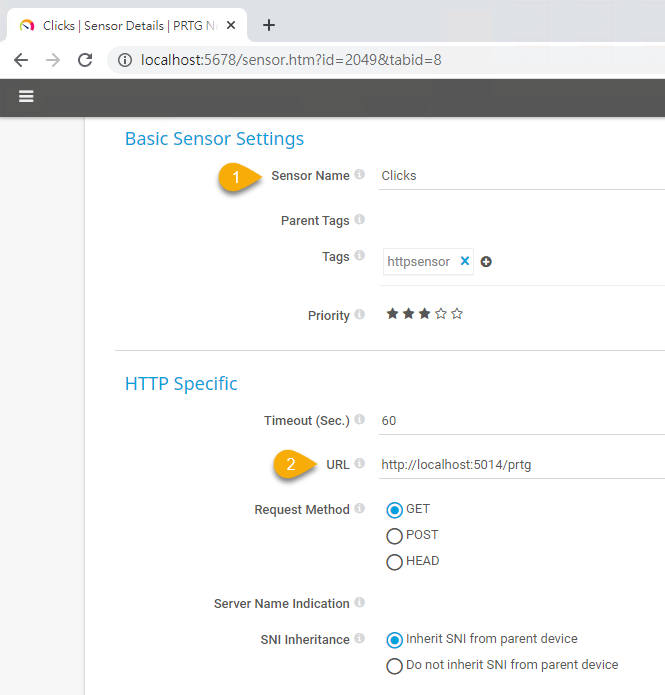
ASP.NET 端備妥,接著在 PRTG 加入 Sensor。新增 Sensor 時用關鍵字找到 HTTP Data Advanced,按 + 新增:
設定 Sensor Name,輸入 URL:
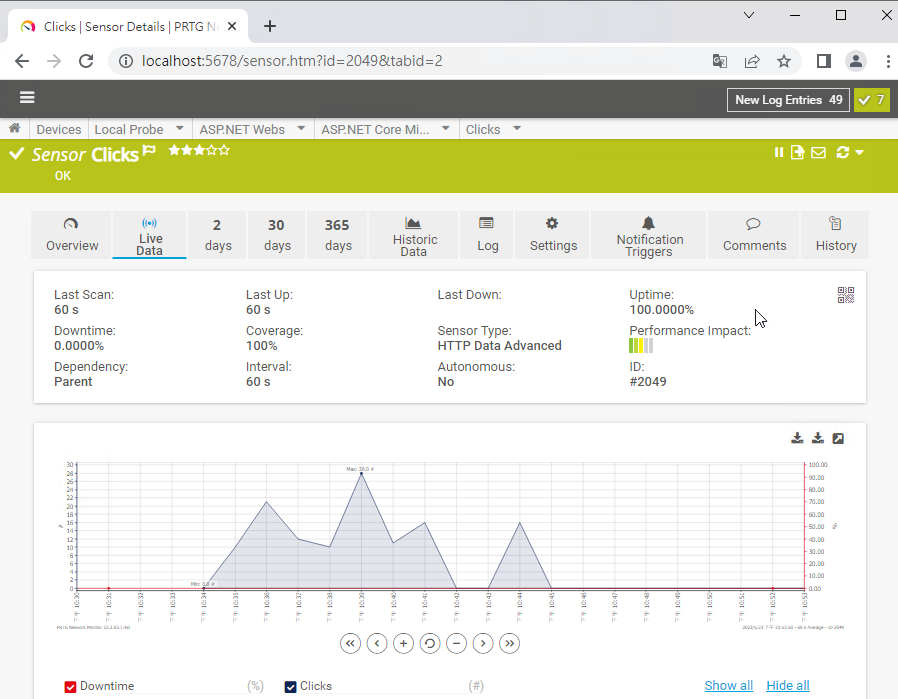
就醬,這個無趣的計量指標便納入 PRTG 的監控範圍囉~
Seimple example to create a custom sensor for PRTG in ASP.NET Core.
Comments
# by 樂透無名
OMG