家用路由器之流量與系統負載長期監測
| | | 0 | |
無線路由器許多人都有,大部分人每天用卻常忘記它的存在,甚至連什麼廠牌放在哪裡都不清楚。
我是另一種類型,喜歡自己動手做愛搞事,在家裡架了迷你家用伺服器跑 cAdvisor + Prometheus + Grafana 效能監控豪華套餐,順便把智慧插座用電統計也拉進 Grafana 儀表板,前陣子升級了無線路由器,想到的下一步是:不如把路由器的溫度、CPU 及線路流量也整合到 Grafana 儀表板吧!
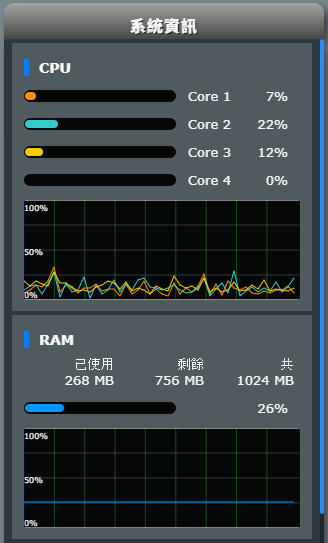
BE58U 的網頁管理介面有 CPU 跟 RAM 使用率,數字是透過 AJAX 呼叫更新,但需用管理者身分登入才能存取,不適合直接當成長期監控的資訊源。
路由器為 Linux Kernel,有 bash 可用也支援 SSH 登入,還能設 cron 排程,能玩的東西可多了。
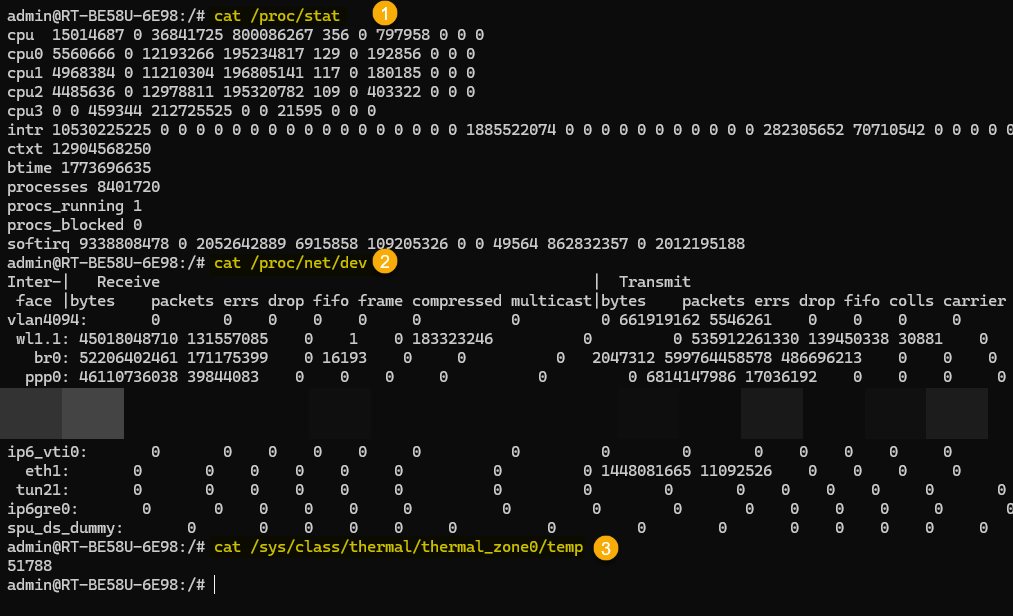
使用 cat /proc/stat、cat /proc/net/dev、cat /sys/class/thermal/thermal_zone0/temp 可以查到 CPU、網路介面流量統計及系統溫度,前二者是累計值,間隔一段時間取樣兩次,由差異值可算出 CPU% 及每秒傳輸 Bytes 數。
有了這些數據,再用 curl POST 昨天介紹的 Prometheus Pushgateway /metrics/job/jobName URL 更新資料,大功告成... 嗎? 沒有。
發現路由器的 bash 環境雖然有 curl,呼叫外部網站 OK,但無法存取內網的網站,curl 程式會閃退,加 --verbose 也一樣沒有任何訊息。原本推測此為安全設計,禁止 curl 存取內網,但測試 AC66U-B1 的 curl 無此限制,而且完全不顯示訊息閃退更像是 Bug。沒查到相關討論,決定先繞道。
原本想改裝 Asuswrt-Merlin,但不幸 BE58U 不在支援清單上... 登楞! 沒關係,山不轉,路轉,路不轉,腦袋轉。
之前玩過用 syslog 觸發 Slack 發送資安事件訊息的小把戲,我可以將 CPU、網路流量、溫度等資料寫入 syslog,透過相同管道觸發 syslog-ng Docker 的 bash 將 metrics 內容轉發到 Prometheus Pushgateway。
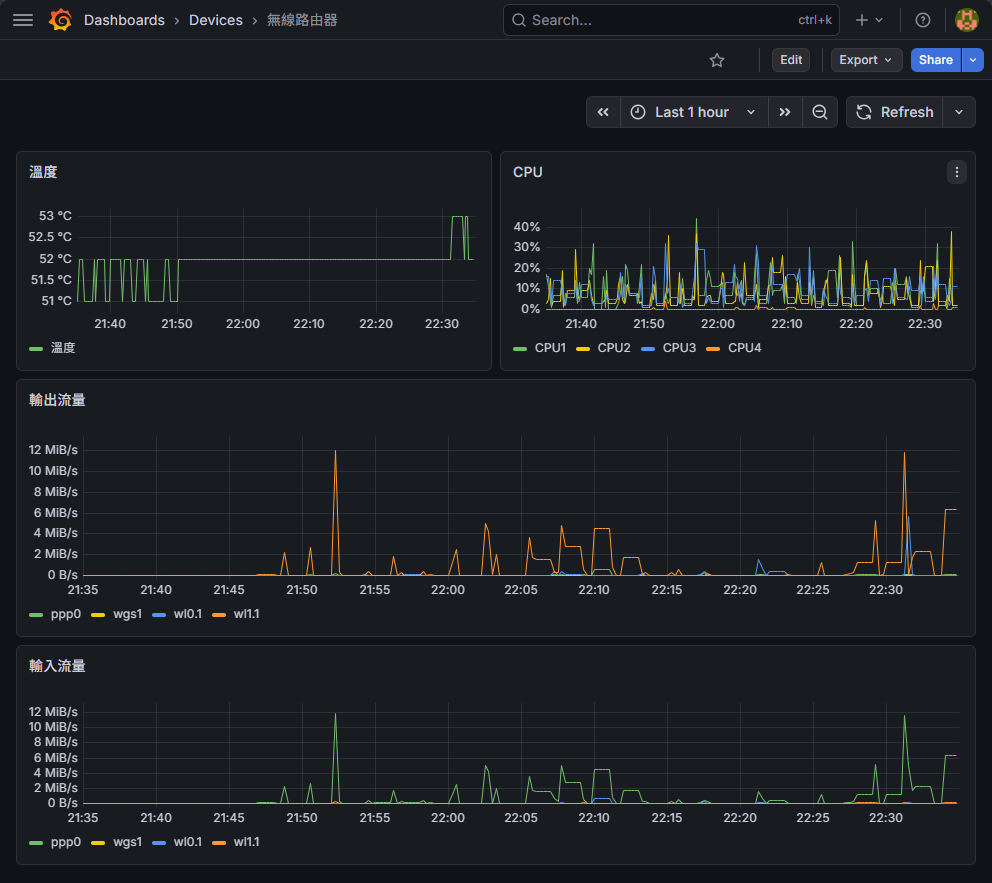
總之,歷經一番努力,幫 AI 幫我搞定 Bash 腳本撰寫,最後我成功在 Grafana 中加入 BE58U 路由器的溫度、CPU % 以及 PPP/2.4G/5G/WireGuard 等網路介面的輸入輸出流量:
應該不會有人也想用這麼曲折的做法,不過,還是附上程式碼留給有緣人參考吧。
以下是位於路由器 /jffs/batch/dump-metrics.sh 的程式碼,負責由 cat /proc/stat、cat /proc/net/dev、cat /sys/class/thermal/thermal_zone0/temp 取得 CPU 使用率、網路介面流量統計及系統溫度,用 logger -t metrics "$output" 將其寫入到路由器的 syslog:
#!/bin/sh

# 一次讀取四個核心的 /proc/stat 快照,回傳格式: "total idle"
snapshot_cpu() {
    cat /proc/stat | awk '/^cpu[0-3] / {
        total = $2+$3+$4+$5+$6+$7+$8
        idle  = $5
        print total, idle
    }'
}
snapshot_net() {
    # /proc/net/dev 欄位: face rx_bytes ... (9 欄) tx_bytes ...
    # 取出 ppp0, wl0.1, wl1.1, wgs1 的 rx_bytes(col2) 及 tx_bytes(col10)
    awk '/^ *(ppp0|wl0\.1|wl1\.1|wgs1):/ {
        gsub(/:/, " ")
        print $1, $2, $10
    }' /proc/net/dev
}

get_metrics() {
    # 第一次快照
    cpu_snap1=$(snapshot_cpu)
    net_snap1=$(snapshot_net)
    sleep 1

    # 第二次快照
    cpu_snap2=$(snapshot_cpu)
    net_snap2=$(snapshot_net)

    # --- CPU 使用率 ---
    output=">metrics #cpu"
    core=0
    cpu_values=$(echo "$cpu_snap1" | while IFS= read -r line1; do
        line2=$(echo "$cpu_snap2" | sed -n "$((core + 1))p")
        total1=$(echo "$line1" | awk '{print $1}')
        idle1=$(echo  "$line1" | awk '{print $2}')
        total2=$(echo "$line2" | awk '{print $1}')
        idle2=$(echo  "$line2" | awk '{print $2}')
        usage=$(( 100 * ( (total2 - total1) - (idle2 - idle1) ) / (total2 - total1) ))
        echo "$usage"
        core=$((core + 1))
    done | tr '\n' ' ')
    output="$output ${cpu_values% }"

    # --- 網路每秒 RX / TX bytes ---
    output="$output #network"
    net_output=$(echo "$net_snap1" | while IFS= read -r line1; do
        iface=$(echo "$line1" | awk '{print $1}')
        line2=$(echo "$net_snap2" | awk -v iface="$iface" '$1 == iface {print}')
        echo "$line1 $line2" | awk '{printf "%s %.0f %.0f\n", $1, $5-$2, $6-$3}'
    done | tr '\n' ' ')
    output="$output ${net_output% }"

    # --- 溫度 ---
    temp=$(cat /sys/class/thermal/thermal_zone0/temp)
    output="$output #temp $((temp / 1000))"
    echo "$output"
    # 將 output 輸出到 syslog
    logger -t metrics "$output"
}

# cron 最小間隔為一分鐘,使用 loop 每 10 秒執行一次 get_metrics
for i in 1 2 3 4 5
do
    get_metrics
    sleep 10
done

# 上傳到 /jffs/batch/dump-metrics.sh 後,使用 cron 每分鐘執行一次
# cru a metrics "*/1 * * * * /jffs/batch/dump-metrics.sh"
syslog-ng 端加入 post-pushgateway.sh,遇到 program 是 metrics 的訊息,將其轉為指定格式 POST 更新到 Prometheus Pushgateway:
#!/bin/bash

read -r data
pushgateway_url="http://<pushgateway-ip>:9091/metrics/job/router"

# 將單行 metrics 轉換為 Prometheus exposition 格式
# 輸入格式範例: metrics #cpu 22 4 7 0 #network wl1.1 21502 83486 ppp0 79783 17799 wl0.1 0 269 wgs1 0 128 #temp 51
format_metrics() {
    echo "$1" | awk '
    {
        n = split($0, tok, " ")
        section = ""; cpu_idx = 0; net_i = 0
        for (i = 1; i <= n; i++) {
            t = tok[i]
            if (t == "#cpu")     { section = "cpu"; continue }
            if (t == "#network") { section = "net"; continue }
            if (t == "#temp")    { section = "temp"; continue }
            if (section == "cpu")  { cpu[++cpu_idx] = t }
            else if (section == "net") { net[++net_i] = t }
            else if (section == "temp") { temp = t }
        }
        print "# TYPE router_cpu gauge"
        for (j = 1; j <= cpu_idx; j++)
            printf "router_cpu{core=\"cpu%d\"} %s\n", j, cpu[j]
        print "# TYPE router_network gauge"
        for (j = 1; j <= net_i; j += 3) {
            printf "router_network{if=\"%s\",dir=\"rx\"} %s\n", net[j], net[j+1]
            printf "router_network{if=\"%s\",dir=\"tx\"} %s\n", net[j], net[j+2]
        }
        print "# TYPE router_temperature gauge"
        printf "router_temperature %s\n", temp
    }
    '
}
format_metrics "$data" | curl --data-binary @- "$pushgateway_url"
Comments
Be the first to post a comment