使用 Prometheus Pushgateway 實現無伺服器情境之效能監控
| | | 0 | |
Prometheus 是目前雲端系統監控平台的首選,其架構採 Pull Mode 拉取模式,由監控服務主動向預先定義的目標端點抓取指標資料,不仰賴觀測對象推送資料。這種設計有不少好處:
- 在動態環境如 Kubernetes 中,實例會頻繁啟動與銷毀。拉取模式配合服務發現 (Service Discovery) 機制可自動取得最新目標列表開始抓取
- 主動抓取在監控對象出錯時(如連線逾時或錯誤),可立即知道該目標離線或異常
- 抓取間隔 (Scrape Interval) 由 Prometheus 決定,忙不過來時可暫緩抓取,不像推送模式會被蜂湧而來的資料壓垮,而統一取樣頻率也有利於時序比對
- 目標端不需要知道監控服務 IP,不必開通向外連線,開發者可透過 /metrics 網址快速驗證功能,方便除錯
因此,上次用 Grafana + Prometheus 監測智慧插座用電量,我便是用 ASP.NET Core Minimal API 寫 Exporter 透過 /metrics 提供插座用電量。但若還到監測對象不是伺服器或微服務(例如:批次作業),或資源有限不值得為了監控多跑 Web,或是被鎖在 NAT 後方不方便打洞讓 Prometheus 連進去,此時就須考慮改採 Push Mode。
Promethues 有個用 Go 開發的 Pushgateway 服務,允許監控對象主動呼叫 REST Web API 回報指標數據,再由其提供 /metrics 端點供 Prometheus 抓取,以此實現 Push Mode。但這個做法有缺點,像是若服務在推送資料後消失,數據將永遠留存直到手動刪除;數字長期未改變時,無法判定是數據相同還是服務掛點。故依官方建議,規劃系統時應優先考量 Pull Mode,Pushgateway 列為無法建立 /metrics 查詢端點時的次佳方案。
我實際做了一次演練,在 Debian 用 Docker 跑 Pushgateway 服務,在 Windows 跑 PowerShell 推送兩種模擬指標:比特幣/乙太幣即時價格,以及個人電腦的 CPU 及 RAM 使用率百分比。以下簡單筆記步驟:
- 使用 docker-compose.yml 跑 Pushgateway 容器:
services: pushgateway: container_name: pushgateway image: prom/pushgateway ports: - 9091:9091 restart: unless-stopped - 用以下 PowerShell 定期查詢
https://api.coingecko.com/api/v3/simple/price?ids=bitcoin,ethereum&vs_currencies=usd取得比特幣與乙太幣最新價格,用Get-CimInstance Win32_Processor及Get-CimInstance Win32_OperatingSystem取得 CPU 使用率,參考官方文件 呼叫POST http://<pushgateway-ip>:9091/metrics/job/<job-name>更新指標數字,程式碼如下:$ErrorActionPreference = "Stop" $pushgatewayUrl = "http://debian13:9091" while ($true) { try { # 從 CoinGecko API 獲取比特幣和以太坊的價格 Invoke-RestMethod -Uri "https://api.coingecko.com/api/v3/simple/price?ids=bitcoin,ethereum&vs_currencies=usd" | ForEach-Object { $bitcoin = $_.bitcoin.usd $ethereum = $_.ethereum.usd } $data = @" # TYPE gauge crypto_price{currency="bitcoin"} $bitcoin crypto_price{currency="ethereum"} $ethereum "@ # 結尾必須加上 \n $data = $data -replace "`r`n", "`n" # Pushgateway 不接受 \r\n Invoke-WebRequest -Uri "$pushgatewayUrl/metrics/job/cryptocurrency" -Method POST -Body $data -ContentType "text/plain" | Out-Null # 從 Windows Performance Counters 獲取 CPU 和 Memory 使用率 $cpu = (Get-CimInstance Win32_Processor | Measure-Object -Property LoadPercentage -Average).Average $os = Get-CimInstance Win32_OperatingSystem $memory = (($os.TotalVisibleMemorySize - $os.FreePhysicalMemory) / $os.TotalVisibleMemorySize) * 100 $data = @" # TYPE gauge user_cpu_percent $cpu user_memory_percent $memory "@ $data = $data -replace "`r`n", "`n" Invoke-WebRequest -Uri "$pushgatewayUrl/metrics/job/pc_resource" -Method POST -Body $data -ContentType "text/plain" | Out-Null Write-Host "$(Get-Date -Format "HH:mm:ss") Updated metrics: CPU $cpu%, Memory $memory%, Bitcoin $bitcoin USD, Ethereum $ethereum USD" } catch { Write-Host "Failed to update metrics: $_" } Start-Sleep -Seconds 15 } - 執行上述腳本,程式會每隔 15 秒更新一次數字,而
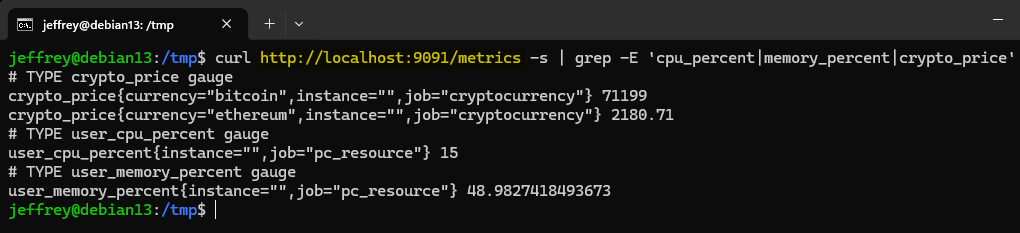
http://<pushgateway-ip>:9091/metrics可查到更新結果,確認指數資料有正確寫入:
- 下一步是在 prometheus.yml 加入這兩組指標:
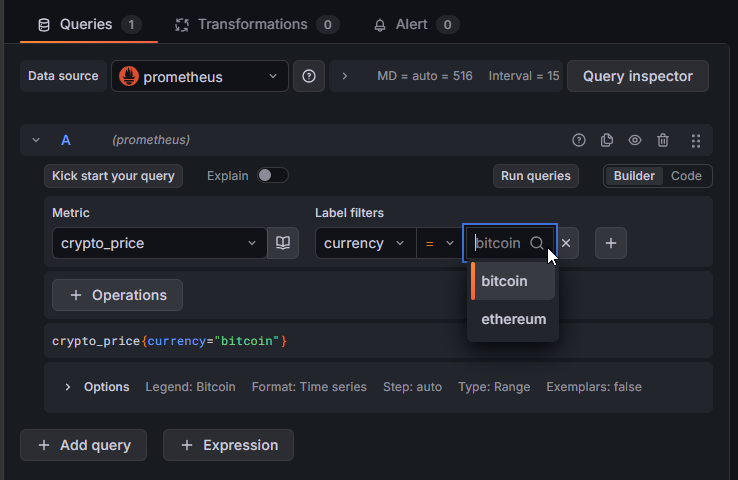
global: scrape_interval: 15s #Scrape interval to every 15 seconds. evaluation_interval: 15s #Evaluate rules every 15 seconds. scrape_configs: - job_name: "pc_resource" honor_labels: true # CRITICAL: Prevents Prometheus from overwriting your custom labels static_configs: - targets: ["localhost:9091"] - job_name: "cryptocurrency" honor_labels: true static_configs: - 之後在 Grafana 可加入指標繪製圖表:
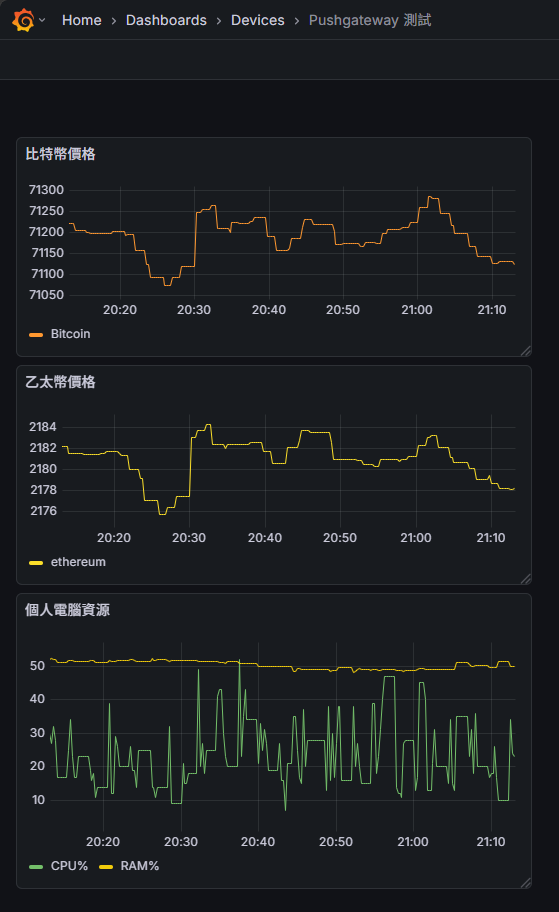
成功在儀表板加入比特幣乙太幣價格走勢,以及個人電腦的 CPU 及 RAM 使用率變化。
Comments
Be the first to post a comment