JMeter 負載測試練習 - CLI 批次執行及簡易硬體 Scale Up 實驗
| | | 0 | |
昨天分享過建立 JMeter 測試計劃,並初步做了單條 Thread 及開 10 條 Thread 的負載測試。
接著我想比較 1、2、3、4、5、6、7、8、9、10、15、20、25、30、40、60、80、100 條 Thread 同時存取的效能表現,總不能改數字、按開始、存結果、改數字、按開始、存結果... 重複做 18 次吧?我知道有人辦得到,但要我這樣做測試,不如一刀給我個痛快。
有個簡便做法:JMeter Thread Group 有個 Ramp-up period (seconds) 參數,可指定 JMeter 不要一次開足所需的 Threads 數,而是在固定秒數內遞增到指定數量,例如:100 條 Thread 設定 200 秒,JMeter 會以每 2 秒加一條的速度逐步增加 Thread。JMeter 則有圖表(Graphic Results)可觀察過程 Thread 數由少到多的平均回應時間及 Throughput 的變化,例如:Throughput (綠線) 上升到一定程度就卡住。
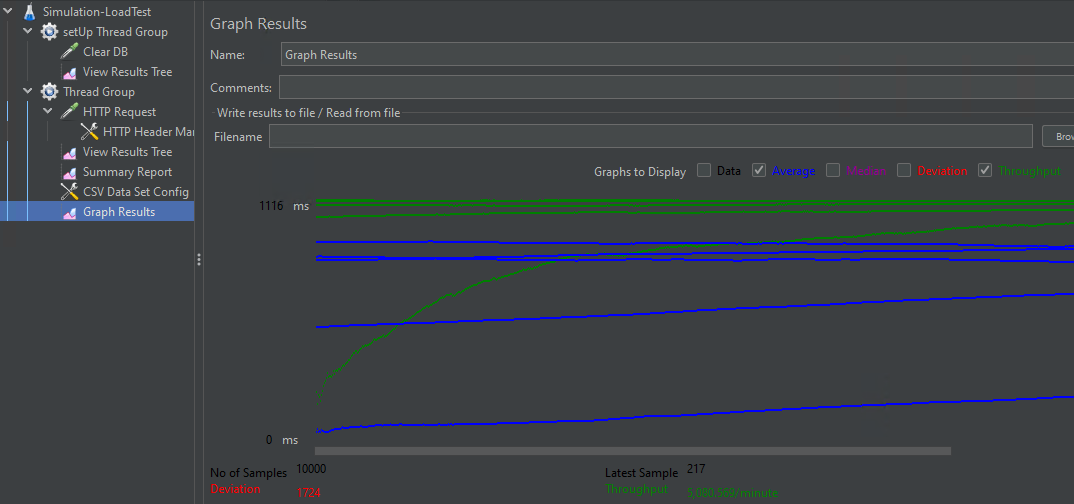
不過,這個做法在我的案例用起來效果不太好,原因是我每條 Thread 的子彈數是有限的 (受限 JSON 檔案,100 發),若 Ramp-Up 設太長,時間還沒到,早開始的 Thread 已子彈打完收工,永遠湊不齊 100 條,而後期子彈打完的 Thread 下線,總 Thread 數下降,整體統計期間的 Thread 數有起伏。第二是當 X 軸太長時,, 圖表折線會從頭繪起,如上圖搞出好幾條綠線跟藍線。這些問題理論上應可設法解決,但由於我想多熟悉 JMeter 進階用法,故選了另一條比較麻煩,但控制度更高的路。
JMeter 提供 CLI 指令輸入參數不顯示圖形介面的執行方式;我打算以 CLI 參數方式動態指定 Thread 數(.jmx 需配合修改),指令範例如下:
# -n: non guid mode 不顯示圖形介面
# -t: 測試計劃 .jmx 路徑
# -l: 結果檔 .jlt (CSV format) 路徑
# -e: 產生報表儀表板網頁
# -o: 報表儀表板網頁檔案輸出資料夾 (必須不存在或空白)
# -J[prop_name]=[value] 設定屬性
jmeter -Jthreads=1 -JticketsLocation=C:\LoadTest\Data\Tickets\ -n -t Simulation-LoadTest.jmx -l ..\Reports\n1.jtl -e -o ..\Report1
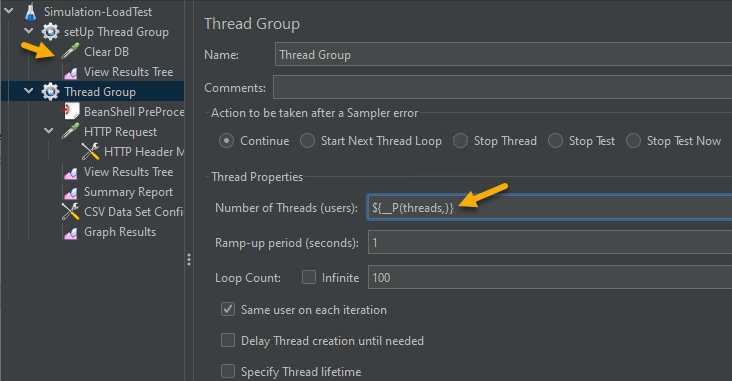
.jmx 有三處需要修改,setUp Thread Group 的 HTTP Request 更名為 Clear DB,避免產生報表時混入測試統計;Thread Group 的 Number of Threads (users) 改為 ${__P(threads,)} 接入 CLI 設定:
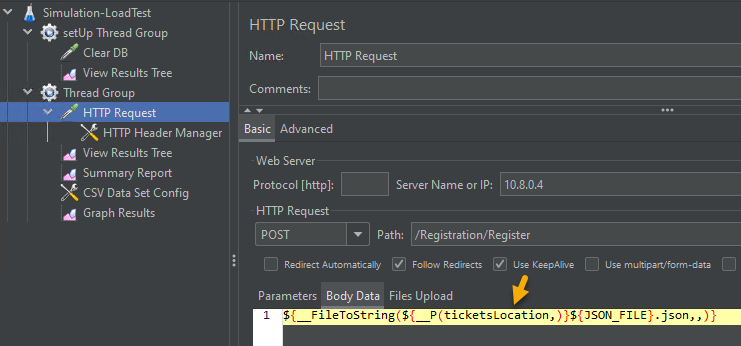
之前用 BeanShell 程式抓 ticketsLocation 有點麻煩,也改成 CLI 參數指定,Request Body 修改成 ${__FileToString(${__P(ticketsLocation,)}${JSON_FILE}.json,,)}:
接著我們就可以用以下程式分別測試從 1 到 100,18 種 Thread 數的數值:
(1,2,3,4,5,6,7,8,9,10,15,20,25,30,40,60,80,100) | ForEach-Object {
	& jmeter "-Jthreads=$_" -JticketsLocation=C:\LoadTest\Data\Tickets\ -n -t Simulation-LoadTest.jmx -l "..\Reports\n$_.jtl" -e -o "..\Reports\Summary$_"
}
\Reports\Reportn 目錄下有個 statics.json 可取得平均回應時間、Throughput 等數字:
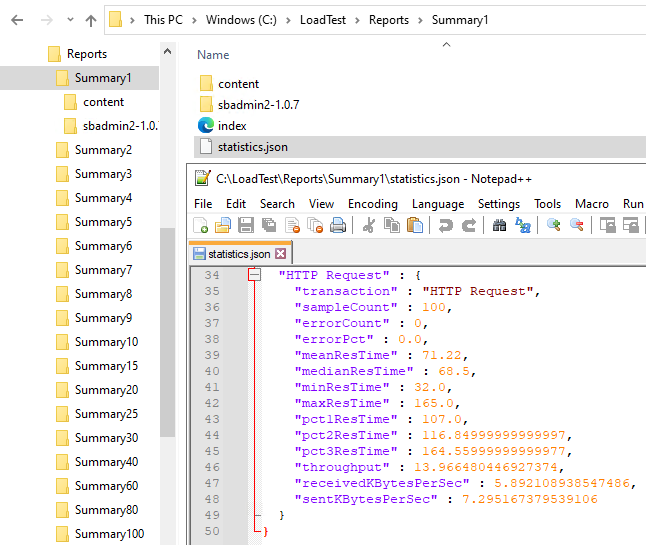
我寫了一小段 PowerShell 取出 JSON 中的數字轉為 CSV:
'Threads,AvgRespTime,Throughput,ErrCount' | Out-File Summary.csv -Encoding utf8
Get-ChildItem .\Summary*\statistics.json | ForEach-Object {
	$jo = Get-Content -Raw $_.FullName | ConvertFrom-Json
	$threads = [regex]::Match($_.FullName, 'Summary(?<n>\d+)').Groups['n'].Value
	$meanResTime = $jo.'HTTP Request'.meanResTime
	$throughput = $jo.'HTTP Request'.throughput
	$errCount = $jo.'HTTP Request'.errorCount
	Write-Output "$threads,$meanResTime,$throughput,$errCount"
} | Out-File Summary.csv -Append -Encoding utf8
用 Excel 產生圖表如下:
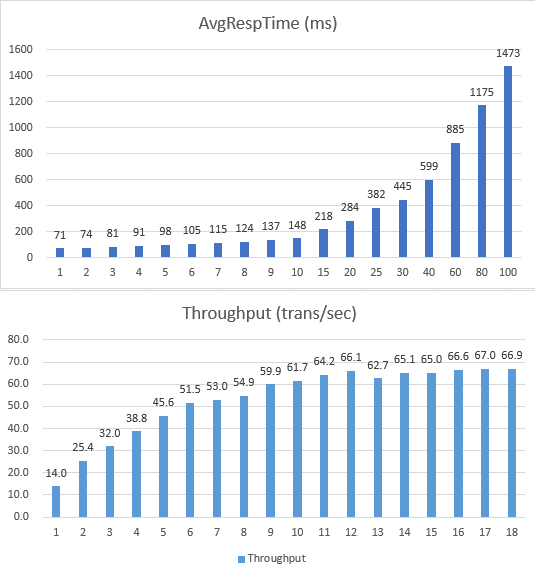
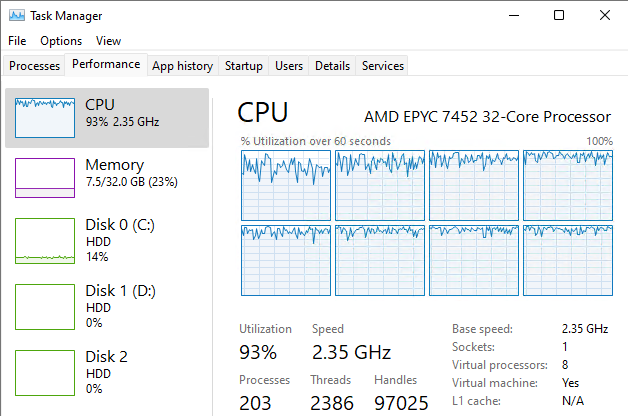
由數據來看,超過 15 Thread 後,每秒處理數量就停在 66 左右,而觀察網站伺服器的 CPU,100 Threads 時為 93%、Disk IO 14%:
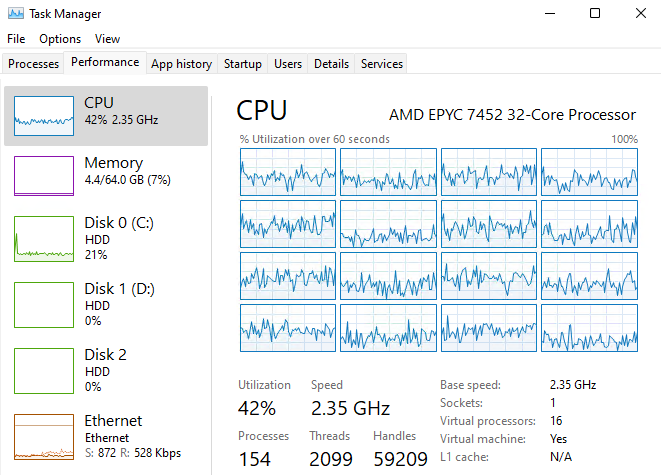
雲端主機的好處是改個設定就能升級硬體,我試著將 VM 由 8 核升級到 16 核,100 Thread 壓測由 Throughput 由 67 上升到 90:

CPU % 下降到 42%,由此推測 CPU 已非瓶頸,但還是加測 32 核實際驗證看看。
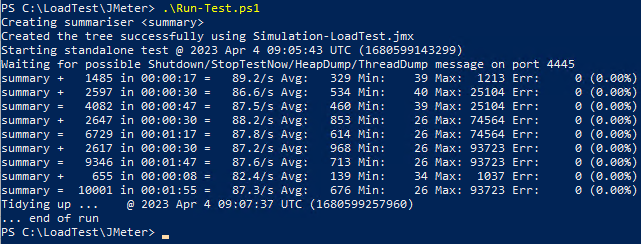
如同預測,Throughtput 停在 87 左右未再提高:
CPU 使用率下降至 22%:
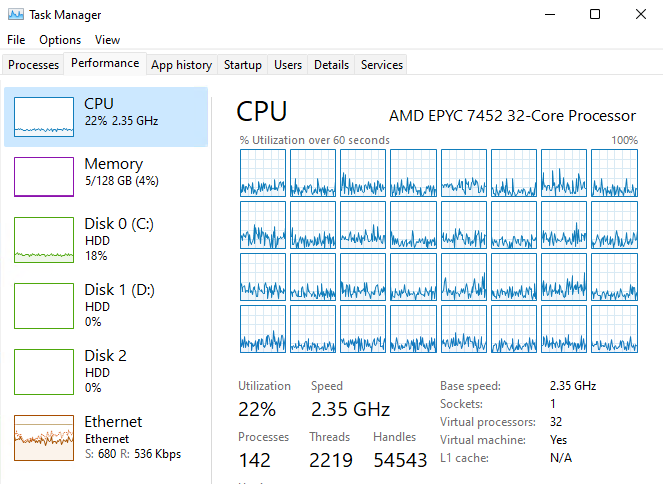
由以上測試可知,在這個案例中,提高到 16 核後便無法再透過 CPU、RAM、Disk 等硬體條件 Scale Up 提升 Throughput,再來得從程式或軟體面下手,之後再玩。
This article demonstrates how to use JMeter CLI commands to control the number of threads, output a summary report, and use PowerShell to organize multiple test results.
Comments
Be the first to post a comment